
Unprecedented May Heat In Greenland, Temperature Hits Stunning 76.6°F
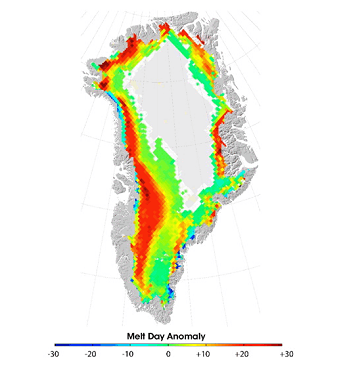 Figure 1. Difference between the number of melt days in 2011 and the average number of melt days during the period 1979 – 2010. Large sections of the island experienced twenty more days with melting conditions than average.
The record books for Greenland’s climate were re-written [last] Tuesday, when the mercury hit 24.8°C (76.6°F) at Narsarsuaq, Greenland, on the southern coast. According to weather records researcher Maximiliano Herrera, this is the hottest temperature on record in Greenland for May, and is just 0.7°C (1.3°F) below the hottest temperature ever measured in Greenland. The previous May record was 22.4°C (72.3°F) at Kangerlussuaq (called Sondre Stormfjord in Danish) on May 31, 1991. The 25.2°C at Narsarsuaq on June 22, 1957 is the only June temperature measured in Greenland warmer than yesterday’s 24.8°C reading. Wunderground’s extremes page shows that the all-time warmest temperature record for Greenland is 25.5°C (77.9°F) set on July 26, 1990.
The exceptional warmth this week was caused by the combination of an intense ridge of high pressure and a local foehn wind, said the Danish Meteorological Institute. The unusual May heat has extended to Scotland, which had its hottest May temperature on record on May 25 at Achnagart: 29.3°C (85°F). Greenland’s Narsarsuaq has seen a string of 3 consecutive days over 70°F this week–the 3rd, 7th, and 12th warmest days there since record keeping began in 1941. The ridge of high pressure responsible is expected to stay in place several more days, bringing additional 70° days over Southern Greenland. The warm May temperatures could be setting the stage for a big Greenland melt season this summer–the International Research Institute for Climate and Society (IRI) is predicting a 50 – 60% that the southern 2/3 of Greenland will experience above-average temperatures this summer. They forecast just a 10 – 15% chance of below-average temperatures.
Why Greenland is important
If the massive icecap on Greenland were to melt, global sea level would rise 7 meters (23 ft).
 Temperatures in Greenland are predicted to rise [at least] 3°C by 2100, to levels similar to those present during that warm period 120,000 years ago. During that period, roughly half of the Greenland ice sheet melted, increasing sea level by 2.2 – 3.4 meters (7.2 – 11.2 ft.) However, the 2007 IPCC report expects melting of the Greenland ice sheet to occur over about a 1,000 year period, delaying much of the expected sea level rise for many centuries. While Greenland’s ice isn’t going to be melting completely and catastrophically flooding low-lying areas of the earth in the next few decades (sea level is only rising about 3 mm per year or 1.2 inches per decade at present), the risk later this century needs to be taken seriously.
Higher sea levels will cause increased erosion, salt water intrusion, and storm surge damage in coastal areas, in addition to a loss of barrier formations such as islands, sand bars, and reefs that would normally protect coastal zones from battering by waves and wind. Additionally, coastal zones are sites of incredible economic and agricultural activity, which would also be negatively affected by higher sea levels. Currently, melting ice from Greenland is thought to cause about 0.7 mm/year of global sea level rise, which is about 20 – 25% of the global total, according to an international research group led by the GFZ German Research Centre for Geosciences, in an article published the latest issue of Earth and Planetary Science Letters, 1 June 2012. In 2007, the IPCC estimated that Greenland ice melt was responsible for only 10 – 15% of the total global sea level rise.
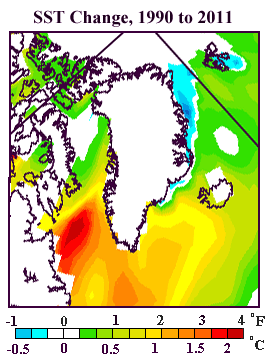
Ice loss in Greenland is accelerating, and if current ice loss trends continue for the next ten years, Greenland’s contribution to sea level rise will double to 1.4 mm/yr by 2022. The increased ice loss in Greenland is being driven by a combination of warmer air temperatures, warmer ocean temperatures, and loss of Arctic sea ice. Ocean temperatures surrounding Southern Greenland have increased by 1 – 2°C since 1990
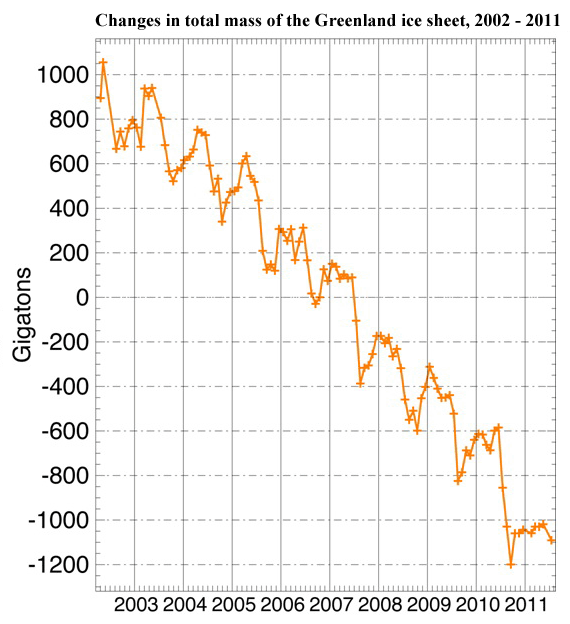
Figure 2. Monthly unsmoothed values of the total mass (in gigatons, Gt), of the Greenland ice sheet from the GRACE satellites. On the horizontal axis, each year begins on 1 January. Each small + symbol is a monthly value. Between 2003 – 2009, Greenland lost an average of 250 gigatons of ice per year. In 2011, the loss was 70% greater than that. Image: Arctic Report Card
Update on the 2011 Greenland melt season
According to the 2011 Arctic Report Card, it was another very warm year in Greenland in 2011, which led to substantial melting of the ice. Here are some of the highlights from the report:
1) The area and duration of melting at the surface of the Greenland ice sheet in summer 2011 were the third highest since 1979.
2) Increased surface melting and below average summer snowfall in recent years has made the icecap steadily darker. In 2011, the icecap had the lowest reflectivity (albedo) of any year since satellite measurements of reflectivity began in 2000.
3) The area of glaciers that empty into the sea continued to decrease, though at less than half the rate of the previous 10 years.
4) Total ice sheet mass loss in 2011 was 70% larger than the 2003 – 2009 average annual loss rate of -250 gigatons per year. According to satellite gravity data obtained since 2002, ice sheet mass loss is accelerating.
Jeff Masters is the founder of the Weather Underground. This piece was originally published at the WunderBlog and was reprinted with permission.
Related Climate Progress Posts:
•Greenland Ice Sheet “Could Undergo a Self-Amplifying Cycle of Melting and Warming … Difficult to Halt,” Scientists Find
•JPL bombshell: Polar ice sheet mass loss is speeding up, on pace for 1 foot sea level rise by 2050
•New study of Greenland under “more realistic forcings” concludes “collapse of the ice-sheet was found to occur between 400 and 560 ppm” of CO2
•M.I.T. doubles its 2095 business-as-usual warming projection to 10°F — with 866 ppm and Arctic warming of 20°F
•Science: CO2 levels haven’t been this high for 15 million years, when it was 5° to 10°F warmer and seas were 75 to 120 feet higher: “We have shown that this dramatic rise in sea level is associated with an increase in CO2 levels of about 100 ppm.”
•Sea levels may rise 3 times faster than IPCC estimated, could hit 6 feet by 2100 [see figure]:
You can return to the main Market News page, or press the Back button on your browser.