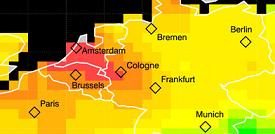
Satellite maps carbon density
 German scientists have mapped regional differences in manmade carbon emissions across Europe using a satellite designed to collect environmental data. carbon emissions are at their highest in densely populated areas.
The general findings of the European Space Agency’s Envisat are not surprising - that carbon emissions are at their highest in the belt that runs from Amsterdam to Frankfurt, the most densely populated part of the continent.
But the research will allow scientists to put concrete figures on what would otherwise be largely theoretical estimates of carbon output.
The mapping also differentiates between naturally occurring carbon emissions and those created by humans.
“The natural CO2 fluxes between the atmosphere and the Earth’s surface are typically much larger than the CO2 fluxes arising from manmade CO2 emissions, making the detection of regional anthropogenic CO2 emission signals quite difficult,” said Dr Michael Buchwitz from the Institute of Environmental Physics at the University of Bremen.
“This does not mean, however, that the anthropogenic fluxes are of minor importance. In fact, the opposite is true because the manmade fluxes are only going in one direction whereas the natural fluxes operate in both directions, taking up atmospheric CO2 when plants grow, but releasing most or all of it again later when the plants decay.
“This results in higher atmospheric CO2 concentrations in the first half of a year followed by lower CO2 during the second half of a year with a minimum around August.”
The mapping will be valuable as it will give scientists a better understanding of natural carbon sinks such as oceans and forests and to what extent they absorb manmade carbon.
“We also don’t know how these sinks will respond to a changing climate,” said Dr Buchwitz.
“It is even possible that some of these sinks will saturate or turn into a CO2 source in the future. With our satellite measurements we hope to be able to provide answers to questions like this in order to make reliable predictions.”
By Sam Bond
You can return to the main Market News page, or press the Back button on your browser.

