Predicting U.S. Coal Plant Retirements
The question concerning coal plant retirements forced by looming regulatory rules, low gas prices, and moribund load growth has changed from “Why?” to “How many plants?” Many highly detailed analyses and reports have been written on the subject by superbly qualified analysts. This approach to estimating potential plant closures is much more qualitative, and much easier to understand. However, the results closely align: About 50 GW are threatened.
Few subjects elicit such a visceral response from members of the U.S. power industry as the forced retirement of coal-fired power plants. For the first half of the last century, commissioning of a new coal plant was considered an economic bonanza for the local economy, heralding an increase in the regional standard of living through electrification and steady, good-paying jobs. Jobs and electricity trumped most environmental issues, not by design but by circumstance. The second half of the 20th century saw the struggle to balance environmental stewardship with power plant development.
Since the formation of the Environmental Protection Agency (EPA) in late 1970, polluting discharges have steadily decreased to the point that today’s air and water cleanliness is unmatched since before the start of the industrial revolution. However, reducing the environmental impact of generating electricity was seldom voluntary. Industry compliance usually was forced by legislative imperatives. Once a legislative goal was set, technology to meet the new rules quickly followed—a process that continues today. Nevertheless, many utilities still firmly resist basic environmental upgrades, such as flue gas desulfurization (FGD) and selective catalytic reduction (SCR). That fight is futile and will only delay the inevitable.
Today, the question has evolved into “How much regulation is enough?” Given that the technology for economic upgrades is reasonably well defined (scrubbers, SCRs, low-NOx burners, fabric filters, and the like) and that upgrades are steadily progressing across the nation’s fleet of coal-fired plants, there must be a balance between costs and benefits. One might describe this as the regulatory finish line. But that’s not the case.
The industry has “taught” regulators that technological solutions will inevitably follow any new, more-stringent rule. This “lead-lag” approach to regulating the industry is fitting when the cost of compliance is reasonably well understood and the benefits are well defined. This was the case for the rules to remove SO2 and NOx from plants’ stack gases, for example. Massive quantities of those and other emissions have been successfully captured over the past two decades at reasonable cost to ratepayers.
Future scenarios will be different. Removing additional pollutants will be significantly more challenging because the technology required is much more expensive—because the chemicals are tougher to remove and their amounts are minute. You might say all the low-hanging fruit has been picked; now we have to bring in the ladders and lifts.
The other challenge is the number of new technologies that the industry is being asked to develop and deploy simultaneously in response to proposed new rules: the upcoming Clean Air Transport Rule (replacing the defunct Clean Air Interstate Rule), the Utility MACT rule, the wet ash classification rule, and the Clean Water Act Section 316(b) upgrades that may force plants using once-through cooling to upgrade to cooling towers. These rules, plus others, such as potential rules covering carbon dioxide (CO2)emissions, are packed end-to-end in the EPA’s regulatory queue with no end in sight.
Some Plants Threatened
Given the significant and myriad capital investments required to complete these upgrades in coming years, plants with poor efficiency, old plants with limited remaining life, plants that are relatively small, plants with few environmental upgrades, and/or plants that operate with very low capacity factors may be forced to close.
An added complication: Low natural gas prices, projected to continue for some time, have further eroded the economic value of older coal plants. This confluence of multiple, expensive upgrades and the cost of maintaining poorly performing assets will undoubtedly force utility executives to make tough choices—often between mothballing, retiring, or repowering—in order to focus investment on baseload-quality coal-fired plants that have decades of life remaining.
The discussion of coal plant retirements is rapidly reaching a crescendo, and it seems that EPA officials are listening to industry concerns, although I’m not sure they are hearing. At the annual winter meeting of the National Association of Regulatory Utility Commissioners (NARUC) in February, EPA Assistant Administrator for Air and Radiation Gina McCarthy tried to soothe industry fears of forced coal plant closures with carefully chosen words when speaking about the just-released utility hazardous air pollutants (HAP) rule: “I think we are not seeing anywhere near the types of retirements that have been projected for worst-case scenarios.” Instead, McCarthy said, the EPA is working to ensure that the HAP and other rules that will control criteria pollutants are “harmonized” so that utilities can use scrubbers to comply with all of the new air regulations.
McCarthy also made a promise to coal-fired generators: “[The Utility MACT rule] is going to be creating standards, but those standards are very sensitive to the different types of technology that are out there in the fleet and in the diversity of the fleet.”
The regulatory approach described by McCarthy is laudable and highly desired by power generators. However, it’s not “worst-case scenarios” that are troubling but rather the “expected case” discussed here (and in ICF International’s companion article, p. 48).
Also noticeably missing from McCarthy’s comments was any mention of the added uncertainty about other environmental investment issues, such as 316(b) upgrades, wet ash disposal classification, greenhouse gas rules, National Ambient Air Quality Standards for CO2, and so on. Perhaps a scrubber and SCR can handle NOx, SO2, mercury, ozone, and HAP pollutants related to the Transport Rule and Utility MACT, but McCarthy completely misses the bigger picture.
Bill Johnson, chairman, president, and CEO of Progress Energy—and the next CEO of Duke Energy, assuming the two companies’ merger is approved—did not. Johnson told the NARUC audience that the industry has “legitimate” concerns about the number of pending EPA regulations. “From my vantage point, the electric utility industry faces a daunting convergence of new federal rules and aggressive deadlines coming at us from multiple fronts,” Johnson said. “My view is over the last couple of years we’ve had a lot more regulation in a much tighter timeframe and a lot higher costs than we’ve had over the past 20 years.”
Johnson also noted that complying with all the pending regulations could cost utilities $245 billion to $329 billion by 2020, citing recent reports by the Edison Electric Institute and ICF International. “To put it in context, the electric sector today has an asset base of about $800 billion, so you can see these are large numbers and they will have an impact on [retail rates],” Johnson said.
A New Basis for Determining Viability
That, in a nutshell, is today’s regulatory debate. The industry’s concerns about forced retirements are valid because the regulatory milieu is rapidly increasing in complexity and requiring response in shortened timespans. Mix in the backlash by a House trying to defund the EPA and put a stop to carbon controls, a burgeoning number of lawsuits pending and expected to be filed related to each new rule, and the poor track record of EPA rules passing judicial scrutiny (remember CAIR and CAMR?). From a utility perspective, the regulatory waters are murkier than ever.
When uncertainty reigns, companies usually react conservatively. In this case, the conservative utility approach will be to retire the less-economic coal plants, make a move toward using more natural gas (with new, refueled, or repowered units), and declare victory.
In past years there were potential economic advantages for many utilities to keep “old soldiers” operating even in the face of poor operating economics. Were legislation passed to manage CO2emissions by way of a market that trades allowances, and if carbon allowance were, as planned, distributed based on historic generation and historic CO2emissions, then older plants would add economic value to a company beyond their ability to produce electricity. But with the carbon market option off the legislative table, another reason to keep these plants disappears. The question today is no longer “if” plants are to be retired but rather “How many, and when?”
Estimating Plant Retirements
Several estimates of coal plant retirements have been published in recent months. For example, The Brattle Group’s report, “Potential Coal Plant Retirements under Emerging Environmental Regulations” was released last December. It predicted 50 GW to 65 GW will retire or will be “at risk” by 2020, based on The Brattle Group’s set of assumptions. In January, ICF International released its “Integrated Energy Outlook” covering the fourth quarter of 2010. In it, ICF projected that “nearly one-fifth of the U.S. coal fleet could retire in response to new air, waste, and water regulations over the next 10 years.” One-fifth of total installed coal-fired capacity in the U.S. is about 68 GW. ICF International’s most likely scenario suggests 53 GW of closures over the next decade, representing about 40% of all coal-fired plants (p. 48).
“40% Less Coal Plant Capacity” and “Dozens of Coal Plants Closed” are attention-getting headlines. However, closer inspection of the data leads to a much different conclusion. In my opinion, better metrics for quantifying the impact of retirements are a plant’s recent capacity factor or the percent of megawatt-hours not sent to the grid.
For example, in my February “Speaking of Power” column, I pointed out that a recent press release from the Sierra Club expressed satisfaction with the closure of 48 coal plants as a sign that “coal is a fuel of the past.” In contrast, I listed 91 recent or projected coal plant closures from 2009 to 2015. However, the average age of those closed plants was 55.1 years, the average plant nameplate was 98.4 MW, and the shutdowns represented only 2.65% of nationwide installed coal-fired capacity. Though the percentage of installed nameplate capacity is very small, the actual MWh lost to the grid are a fraction of 1%, as you will soon see. Which is the more descriptive metric? My conclusion is that these closures are just business as usual rather than the seismic shift in fuels used for power generation, as the Sierra Club release would suggest.
My approach to estimating future coal plant closures is to examine existing coal-fired plant performance metrics and then make a qualitative assessment of those plants that are at risk. The data source used for this analysis is a comprehensive database of the physical and performance characteristics of all U.S. coal-fired power plants created by Burns & McDonnell and made available to POWER for this report. I selected, ran, and checked each of the database queries independently, with no outside influence, so if you don’t like the information presented, blame me, not Burns & McDonnell.
The analysis followed a three-step process:
The U.S. coal-fired fleet consists of 1,105 units with a nameplate capacity of 342.733 GW, according to the Burns & McDonnell database. Because plant age is often cited as a reason for retirement, it’s useful to examine the fleet’s age. Figure 1 illustrates the age of each unit in the database, calculated as the difference between 2011 and the year it began commercial operation.
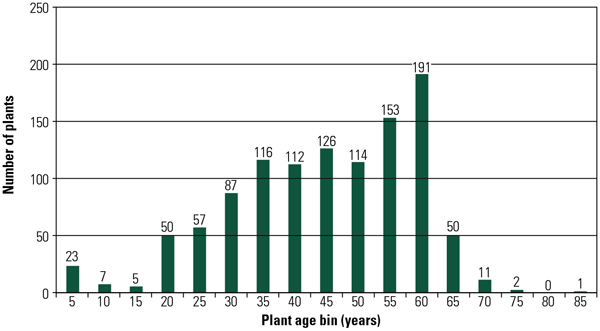
1. Coal fleet age distribution. Each of the 1,105 individual coal-fired units was placed into a five-year age category. For example, the category “5” represents plants that are 5 years old or less. The category “10” represents plants that are more than 5 and less than or equal to 10 years old. According to the database, one 10-MW unit built in 1925 is still on “active duty.” Source: POWER and Burns & McDonnell.
The average age of all units is 42.5 years, the MW-weighted age is 37.1 years, and the capacity factor–weighted age is 40.0 years. The MW-weighted age tells us that the average size of new power plants has been increasing over the past few decades. The capacity factor–weighted age tells us that the capacity factor of newer plants is, on average, higher. No matter how you cut the numbers, the fleet continues to age—although we shouldn’t mistake age alone as representative of the economic life of a power plant.
The database includes many useful metrics that describe interesting characteristics of the fleet, including type of coal used (Figure 2), boiler manufacturer (Figure 3), and boiler type (Figure 4).
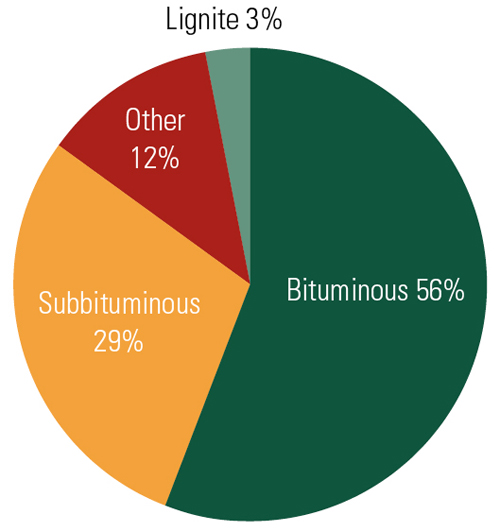
2. Coal fleet fuel use. Over 86% of the coal fleet burns either a bituminous or a subbituminous fuel. Source: POWER and Burns & McDonnell.
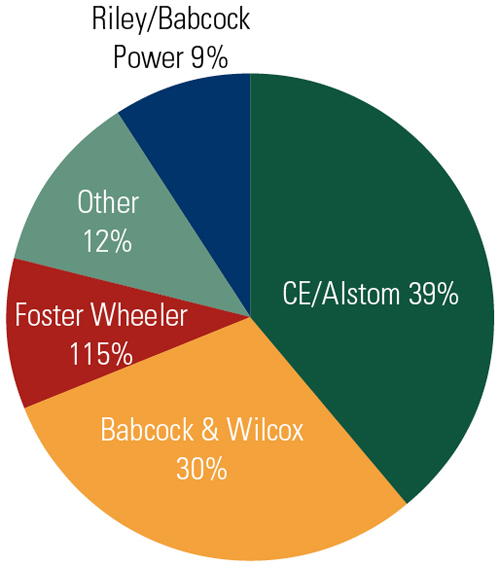
3. Coal fleet boiler manufacturers. Source: POWER and Burns & McDonnell.

4. Coal fleet boiler design. Source: POWER and Burns & McDonnell.
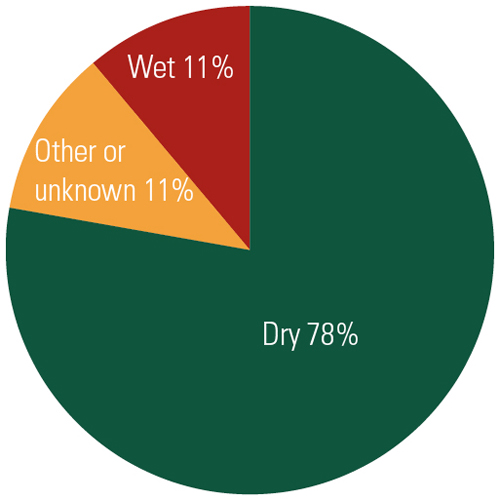
5.Coal fleet bottom ash handling. Source: POWER and Burns & McDonnell.
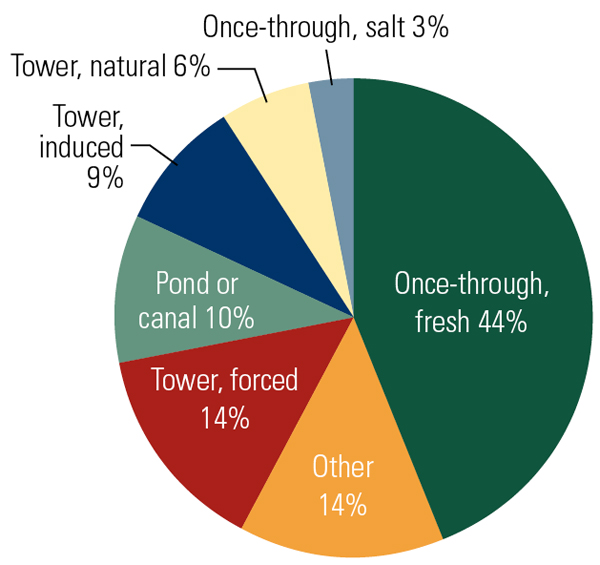
6. Coal fleet cooling water source. Source: POWER and Burns & McDonnell.
Determine Fleet Baseline Performance
Three metrics were selected to describe the performance of the current fleet of coal-fired plants. The first is the average size of plants constructed over time (Figure 7). Interestingly, the glory days for building very large central station plants was the 1960s, especially for those first supercritical plants, ranging up to 1,300 MW.
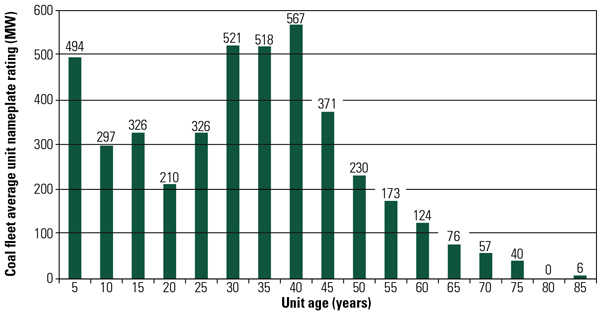
7. Coal fleet average unit nameplate rating. The average unit rating is calculated by averaging the rating all of the units within each age category. Source: POWER and Burns & McDonnell
Given that these large plants remain vital baseload resources, it’s no wonder that the capacity factor–weighted age of the fleet is 40 years. Although the number of plants constructed and placed into operation over the past 10 years has fallen short of predictions, their average nameplate rating increased significantly.
The average capacity factor illustrates that plants under 40 years old are the backbone of the baseload fleet; as a plant hits about the 50-year milestone, operation appears to shift to more load-following or cycling operation, as suggested by decreasing capacity factors (Figure 8). For comparison, the overall average fleet capacity factor is approximately 62%. However, 455 plants (not including recently commissioned ones, for which capacity factor information was not available) reported an annual capacity factor of 70% or higher.
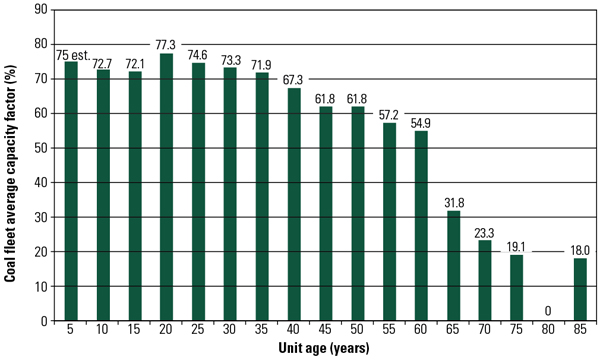
8. Coal fleet average capacity factor. The average unit capacity factor is calculated by averaging the reported capacity factor of all the units within each age category. Many of the units in the five years or less category do not have data available. A 75% capacity factor was estimated. In all categories, if capacity factor data was not available, that unit was omitted from the average. Source: POWER and Burns & McDonnell.
The average size of plants over 40 years of age is 400 MW. Average plant heat rate, as expected, generally improved in recent years (Figure 9). Plant heat rate is difficult to determine for some plants, so the Burns & McDonnell database does have a few plant heat rate gaps (81% of the plants reported). Nevertheless, the trends and averages presented here remain instructive.
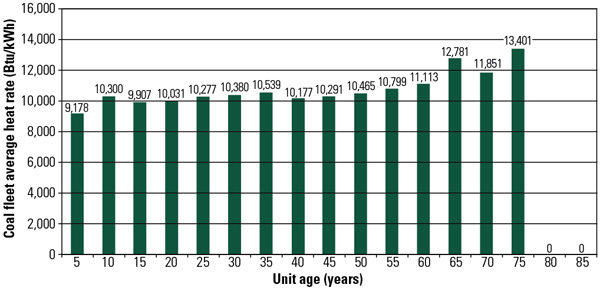
9. Coal fleet average heat rate. The average unit heat rate is calculated by averaging the reported heat rate of all the units within each age category. Heat rate data for only a single unit was available in the “five years or less” category. In the remainder of the categories, if heat rate data was not available, then that unit was omitted from the average. Source: POWER and Burns & McDonnell.
Develop Predictions
Predictions must be scenario-based, given the current regulatory uncertainty. That means that unit-based decisions using specific company economic modeling, independent system operator dispatching decisions, and other regional grid issues are ignored, in contrast with the ICF International analysis. Instead, this database is used more as a simple tool for sorting groups of plants that appear to be vulnerable to closure.
For example, of the 1,105 units queried, 846 do not have an SCR system, 619 units do not have FGD, and 578 units have neither SCR nor FGD (nor have they announced plans to add either). It’s reasonable to conclude that some subsets of those 578 units, at a minimum, are candidates for retirement.
Drilling down further into the subset of plants without air quality control systems (AQCS) reveals additional age-related information (Table 1). The average capacity factor for this dataset is 57% and the average year the plants were built is 1962. Compare that with the entire database (with a 62% average capacity factor and 1969 as the average year built) and to the plants with both SCR and FGD (with a 67% average capacity factor and 1979 as the average year built) and it’s clear that units without any AQCS are, on average, operating less and are much older than those with the latest AQCS equipment. A regional analysis would reveal more interesting information, but space constraints prevent pursuing that level of detail.

Table 1. Coal-fired power plants without air quality control systems, sorted by year built. Source: POWER.
Another way of slicing and dicing the data is to use capacity factor as the independent variable (Table 2). This query reveals a group of units that may be considered serious candidates for closure in the coming years. Will these units—all without SCR and FGD, with lower capacity factors, with relatively low nameplate ratings, and well over 50 years old—be serious candidates for significant future capital investment? A few may be retrofitted, fuel-switched, or even repowered in the future, but certainly not all 305 units.

Table 2. Coal-fired power plants without air quality control systems, sorted by capacity factor. Source: POWER.
As an aside, only 24 units among this group of 305 have a wet ash system (out of a total of 120 units fleetwide). The database found 41 units overall (10 GW total) with wet ash systems but no AQCS systems. The fleetwide data shows 120 units with wet bottom ash systems, representing 39.9 GW, 332 MW average plant size, and an average capacity factor of 61%.
The average capacity factor of this non-AQCS subset of plants listed in Table 1 was just 55%. More interesting are the 226 units of the 589 listed in Table 2 that use once-through cooling and that could be subject to review under the proposed new cooling water intake structure rules.
You Make the Call
The database was thoroughly exercised with numerous queries using different performance metrics and equipment configurations. When the dust settled, Table 2 appears to present a reasonable prediction of the possible range of coal-fired plant closures over the next decade.
The analysis performed used plant averages even though no plant is average. Each unit at each plant is unique in its design, and plant owners have their own specific economic evaluations and decision-making processes.
However, given the large capital investment required for upgrades, existing low capacity factors, facility age, an unstable regulatory environment, low natural gas prices, surplus combined-cycle capacity, and shallow load growth, it’s easy to conclude that the plants listed in Table 2 with less than a 50% capacity factor could be strong candidates for retirement within the next decade.
Even if the cutoff is set at plants with a capacity factor of 60% or less, the generation lost (11.9%) represents only about 5.8% of our current annual electricity demand. In a macro sense, there is sufficient surplus natural gas–fired capacity to compensate for that loss.
If Washington dangles the fuel-switch carrot (via tax credits, grants, and the like), then a few of these borderline plants become candidates for replacement or repowering. Given that scenario, a loss of 50 GW of coal-fired capacity over the next decade is a very reasonable prediction. — Dr. Robert Peltier, PE is POWER’s editor-in-chief. Grant Grothen, PE (ggrothen@burnsmcd.com), a principal for Burns & McDonnell, provided valuable assistance and database information
To see how Klean Industries is developing environmentally friendly, cost effective coal gasification technologies equiped wih the latest technologies and systems please click here.
Few subjects elicit such a visceral response from members of the U.S. power industry as the forced retirement of coal-fired power plants. For the first half of the last century, commissioning of a new coal plant was considered an economic bonanza for the local economy, heralding an increase in the regional standard of living through electrification and steady, good-paying jobs. Jobs and electricity trumped most environmental issues, not by design but by circumstance. The second half of the 20th century saw the struggle to balance environmental stewardship with power plant development.
Since the formation of the Environmental Protection Agency (EPA) in late 1970, polluting discharges have steadily decreased to the point that today’s air and water cleanliness is unmatched since before the start of the industrial revolution. However, reducing the environmental impact of generating electricity was seldom voluntary. Industry compliance usually was forced by legislative imperatives. Once a legislative goal was set, technology to meet the new rules quickly followed—a process that continues today. Nevertheless, many utilities still firmly resist basic environmental upgrades, such as flue gas desulfurization (FGD) and selective catalytic reduction (SCR). That fight is futile and will only delay the inevitable.
Today, the question has evolved into “How much regulation is enough?” Given that the technology for economic upgrades is reasonably well defined (scrubbers, SCRs, low-NOx burners, fabric filters, and the like) and that upgrades are steadily progressing across the nation’s fleet of coal-fired plants, there must be a balance between costs and benefits. One might describe this as the regulatory finish line. But that’s not the case.
The industry has “taught” regulators that technological solutions will inevitably follow any new, more-stringent rule. This “lead-lag” approach to regulating the industry is fitting when the cost of compliance is reasonably well understood and the benefits are well defined. This was the case for the rules to remove SO2 and NOx from plants’ stack gases, for example. Massive quantities of those and other emissions have been successfully captured over the past two decades at reasonable cost to ratepayers.
Future scenarios will be different. Removing additional pollutants will be significantly more challenging because the technology required is much more expensive—because the chemicals are tougher to remove and their amounts are minute. You might say all the low-hanging fruit has been picked; now we have to bring in the ladders and lifts.
The other challenge is the number of new technologies that the industry is being asked to develop and deploy simultaneously in response to proposed new rules: the upcoming Clean Air Transport Rule (replacing the defunct Clean Air Interstate Rule), the Utility MACT rule, the wet ash classification rule, and the Clean Water Act Section 316(b) upgrades that may force plants using once-through cooling to upgrade to cooling towers. These rules, plus others, such as potential rules covering carbon dioxide (CO2)emissions, are packed end-to-end in the EPA’s regulatory queue with no end in sight.
Some Plants Threatened
Given the significant and myriad capital investments required to complete these upgrades in coming years, plants with poor efficiency, old plants with limited remaining life, plants that are relatively small, plants with few environmental upgrades, and/or plants that operate with very low capacity factors may be forced to close.
An added complication: Low natural gas prices, projected to continue for some time, have further eroded the economic value of older coal plants. This confluence of multiple, expensive upgrades and the cost of maintaining poorly performing assets will undoubtedly force utility executives to make tough choices—often between mothballing, retiring, or repowering—in order to focus investment on baseload-quality coal-fired plants that have decades of life remaining.
The discussion of coal plant retirements is rapidly reaching a crescendo, and it seems that EPA officials are listening to industry concerns, although I’m not sure they are hearing. At the annual winter meeting of the National Association of Regulatory Utility Commissioners (NARUC) in February, EPA Assistant Administrator for Air and Radiation Gina McCarthy tried to soothe industry fears of forced coal plant closures with carefully chosen words when speaking about the just-released utility hazardous air pollutants (HAP) rule: “I think we are not seeing anywhere near the types of retirements that have been projected for worst-case scenarios.” Instead, McCarthy said, the EPA is working to ensure that the HAP and other rules that will control criteria pollutants are “harmonized” so that utilities can use scrubbers to comply with all of the new air regulations.
McCarthy also made a promise to coal-fired generators: “[The Utility MACT rule] is going to be creating standards, but those standards are very sensitive to the different types of technology that are out there in the fleet and in the diversity of the fleet.”
The regulatory approach described by McCarthy is laudable and highly desired by power generators. However, it’s not “worst-case scenarios” that are troubling but rather the “expected case” discussed here (and in ICF International’s companion article, p. 48).
Also noticeably missing from McCarthy’s comments was any mention of the added uncertainty about other environmental investment issues, such as 316(b) upgrades, wet ash disposal classification, greenhouse gas rules, National Ambient Air Quality Standards for CO2, and so on. Perhaps a scrubber and SCR can handle NOx, SO2, mercury, ozone, and HAP pollutants related to the Transport Rule and Utility MACT, but McCarthy completely misses the bigger picture.
Bill Johnson, chairman, president, and CEO of Progress Energy—and the next CEO of Duke Energy, assuming the two companies’ merger is approved—did not. Johnson told the NARUC audience that the industry has “legitimate” concerns about the number of pending EPA regulations. “From my vantage point, the electric utility industry faces a daunting convergence of new federal rules and aggressive deadlines coming at us from multiple fronts,” Johnson said. “My view is over the last couple of years we’ve had a lot more regulation in a much tighter timeframe and a lot higher costs than we’ve had over the past 20 years.”
Johnson also noted that complying with all the pending regulations could cost utilities $245 billion to $329 billion by 2020, citing recent reports by the Edison Electric Institute and ICF International. “To put it in context, the electric sector today has an asset base of about $800 billion, so you can see these are large numbers and they will have an impact on [retail rates],” Johnson said.
A New Basis for Determining Viability
That, in a nutshell, is today’s regulatory debate. The industry’s concerns about forced retirements are valid because the regulatory milieu is rapidly increasing in complexity and requiring response in shortened timespans. Mix in the backlash by a House trying to defund the EPA and put a stop to carbon controls, a burgeoning number of lawsuits pending and expected to be filed related to each new rule, and the poor track record of EPA rules passing judicial scrutiny (remember CAIR and CAMR?). From a utility perspective, the regulatory waters are murkier than ever.
When uncertainty reigns, companies usually react conservatively. In this case, the conservative utility approach will be to retire the less-economic coal plants, make a move toward using more natural gas (with new, refueled, or repowered units), and declare victory.
In past years there were potential economic advantages for many utilities to keep “old soldiers” operating even in the face of poor operating economics. Were legislation passed to manage CO2emissions by way of a market that trades allowances, and if carbon allowance were, as planned, distributed based on historic generation and historic CO2emissions, then older plants would add economic value to a company beyond their ability to produce electricity. But with the carbon market option off the legislative table, another reason to keep these plants disappears. The question today is no longer “if” plants are to be retired but rather “How many, and when?”
Estimating Plant Retirements
Several estimates of coal plant retirements have been published in recent months. For example, The Brattle Group’s report, “Potential Coal Plant Retirements under Emerging Environmental Regulations” was released last December. It predicted 50 GW to 65 GW will retire or will be “at risk” by 2020, based on The Brattle Group’s set of assumptions. In January, ICF International released its “Integrated Energy Outlook” covering the fourth quarter of 2010. In it, ICF projected that “nearly one-fifth of the U.S. coal fleet could retire in response to new air, waste, and water regulations over the next 10 years.” One-fifth of total installed coal-fired capacity in the U.S. is about 68 GW. ICF International’s most likely scenario suggests 53 GW of closures over the next decade, representing about 40% of all coal-fired plants (p. 48).
“40% Less Coal Plant Capacity” and “Dozens of Coal Plants Closed” are attention-getting headlines. However, closer inspection of the data leads to a much different conclusion. In my opinion, better metrics for quantifying the impact of retirements are a plant’s recent capacity factor or the percent of megawatt-hours not sent to the grid.
For example, in my February “Speaking of Power” column, I pointed out that a recent press release from the Sierra Club expressed satisfaction with the closure of 48 coal plants as a sign that “coal is a fuel of the past.” In contrast, I listed 91 recent or projected coal plant closures from 2009 to 2015. However, the average age of those closed plants was 55.1 years, the average plant nameplate was 98.4 MW, and the shutdowns represented only 2.65% of nationwide installed coal-fired capacity. Though the percentage of installed nameplate capacity is very small, the actual MWh lost to the grid are a fraction of 1%, as you will soon see. Which is the more descriptive metric? My conclusion is that these closures are just business as usual rather than the seismic shift in fuels used for power generation, as the Sierra Club release would suggest.
My approach to estimating future coal plant closures is to examine existing coal-fired plant performance metrics and then make a qualitative assessment of those plants that are at risk. The data source used for this analysis is a comprehensive database of the physical and performance characteristics of all U.S. coal-fired power plants created by Burns & McDonnell and made available to POWER for this report. I selected, ran, and checked each of the database queries independently, with no outside influence, so if you don’t like the information presented, blame me, not Burns & McDonnell.
The analysis followed a three-step process:
- Characterize the fleet. This step examined the fuels used, boiler manufacturers, boiler types, and other key plant data. This information is useful in light of the earlier discussion, especially considering pending wet ash classification and cooling water intake rules. This industry-characterizing data is difficult to obtain, so it’s presented here for your use.
- Determine fleet baseline performance. Baseline performance data is presented for key performance metrics, including plant age, heat rate, and capacity factor. For ease of presentation, plants were grouped into five-year age “bins.”
- Develop reasonable predictions. Using the baseline performance as a starting point, I analyzed dozens of alternative plant configurations and historic performance. One particular database query seems to present good information for estimating potential plant closures.
The U.S. coal-fired fleet consists of 1,105 units with a nameplate capacity of 342.733 GW, according to the Burns & McDonnell database. Because plant age is often cited as a reason for retirement, it’s useful to examine the fleet’s age. Figure 1 illustrates the age of each unit in the database, calculated as the difference between 2011 and the year it began commercial operation.

1. Coal fleet age distribution. Each of the 1,105 individual coal-fired units was placed into a five-year age category. For example, the category “5” represents plants that are 5 years old or less. The category “10” represents plants that are more than 5 and less than or equal to 10 years old. According to the database, one 10-MW unit built in 1925 is still on “active duty.” Source: POWER and Burns & McDonnell.
The average age of all units is 42.5 years, the MW-weighted age is 37.1 years, and the capacity factor–weighted age is 40.0 years. The MW-weighted age tells us that the average size of new power plants has been increasing over the past few decades. The capacity factor–weighted age tells us that the capacity factor of newer plants is, on average, higher. No matter how you cut the numbers, the fleet continues to age—although we shouldn’t mistake age alone as representative of the economic life of a power plant.
The database includes many useful metrics that describe interesting characteristics of the fleet, including type of coal used (Figure 2), boiler manufacturer (Figure 3), and boiler type (Figure 4).

2. Coal fleet fuel use. Over 86% of the coal fleet burns either a bituminous or a subbituminous fuel. Source: POWER and Burns & McDonnell.

3. Coal fleet boiler manufacturers. Source: POWER and Burns & McDonnell.

4. Coal fleet boiler design. Source: POWER and Burns & McDonnell.

5.Coal fleet bottom ash handling. Source: POWER and Burns & McDonnell.

6. Coal fleet cooling water source. Source: POWER and Burns & McDonnell.
Determine Fleet Baseline Performance
Three metrics were selected to describe the performance of the current fleet of coal-fired plants. The first is the average size of plants constructed over time (Figure 7). Interestingly, the glory days for building very large central station plants was the 1960s, especially for those first supercritical plants, ranging up to 1,300 MW.

7. Coal fleet average unit nameplate rating. The average unit rating is calculated by averaging the rating all of the units within each age category. Source: POWER and Burns & McDonnell
Given that these large plants remain vital baseload resources, it’s no wonder that the capacity factor–weighted age of the fleet is 40 years. Although the number of plants constructed and placed into operation over the past 10 years has fallen short of predictions, their average nameplate rating increased significantly.
The average capacity factor illustrates that plants under 40 years old are the backbone of the baseload fleet; as a plant hits about the 50-year milestone, operation appears to shift to more load-following or cycling operation, as suggested by decreasing capacity factors (Figure 8). For comparison, the overall average fleet capacity factor is approximately 62%. However, 455 plants (not including recently commissioned ones, for which capacity factor information was not available) reported an annual capacity factor of 70% or higher.

8. Coal fleet average capacity factor. The average unit capacity factor is calculated by averaging the reported capacity factor of all the units within each age category. Many of the units in the five years or less category do not have data available. A 75% capacity factor was estimated. In all categories, if capacity factor data was not available, that unit was omitted from the average. Source: POWER and Burns & McDonnell.
The average size of plants over 40 years of age is 400 MW. Average plant heat rate, as expected, generally improved in recent years (Figure 9). Plant heat rate is difficult to determine for some plants, so the Burns & McDonnell database does have a few plant heat rate gaps (81% of the plants reported). Nevertheless, the trends and averages presented here remain instructive.

9. Coal fleet average heat rate. The average unit heat rate is calculated by averaging the reported heat rate of all the units within each age category. Heat rate data for only a single unit was available in the “five years or less” category. In the remainder of the categories, if heat rate data was not available, then that unit was omitted from the average. Source: POWER and Burns & McDonnell.
Develop Predictions
Predictions must be scenario-based, given the current regulatory uncertainty. That means that unit-based decisions using specific company economic modeling, independent system operator dispatching decisions, and other regional grid issues are ignored, in contrast with the ICF International analysis. Instead, this database is used more as a simple tool for sorting groups of plants that appear to be vulnerable to closure.
For example, of the 1,105 units queried, 846 do not have an SCR system, 619 units do not have FGD, and 578 units have neither SCR nor FGD (nor have they announced plans to add either). It’s reasonable to conclude that some subsets of those 578 units, at a minimum, are candidates for retirement.
Drilling down further into the subset of plants without air quality control systems (AQCS) reveals additional age-related information (Table 1). The average capacity factor for this dataset is 57% and the average year the plants were built is 1962. Compare that with the entire database (with a 62% average capacity factor and 1969 as the average year built) and to the plants with both SCR and FGD (with a 67% average capacity factor and 1979 as the average year built) and it’s clear that units without any AQCS are, on average, operating less and are much older than those with the latest AQCS equipment. A regional analysis would reveal more interesting information, but space constraints prevent pursuing that level of detail.

Table 1. Coal-fired power plants without air quality control systems, sorted by year built. Source: POWER.
Another way of slicing and dicing the data is to use capacity factor as the independent variable (Table 2). This query reveals a group of units that may be considered serious candidates for closure in the coming years. Will these units—all without SCR and FGD, with lower capacity factors, with relatively low nameplate ratings, and well over 50 years old—be serious candidates for significant future capital investment? A few may be retrofitted, fuel-switched, or even repowered in the future, but certainly not all 305 units.

Table 2. Coal-fired power plants without air quality control systems, sorted by capacity factor. Source: POWER.
As an aside, only 24 units among this group of 305 have a wet ash system (out of a total of 120 units fleetwide). The database found 41 units overall (10 GW total) with wet ash systems but no AQCS systems. The fleetwide data shows 120 units with wet bottom ash systems, representing 39.9 GW, 332 MW average plant size, and an average capacity factor of 61%.
The average capacity factor of this non-AQCS subset of plants listed in Table 1 was just 55%. More interesting are the 226 units of the 589 listed in Table 2 that use once-through cooling and that could be subject to review under the proposed new cooling water intake structure rules.
You Make the Call
The database was thoroughly exercised with numerous queries using different performance metrics and equipment configurations. When the dust settled, Table 2 appears to present a reasonable prediction of the possible range of coal-fired plant closures over the next decade.
The analysis performed used plant averages even though no plant is average. Each unit at each plant is unique in its design, and plant owners have their own specific economic evaluations and decision-making processes.
However, given the large capital investment required for upgrades, existing low capacity factors, facility age, an unstable regulatory environment, low natural gas prices, surplus combined-cycle capacity, and shallow load growth, it’s easy to conclude that the plants listed in Table 2 with less than a 50% capacity factor could be strong candidates for retirement within the next decade.
Even if the cutoff is set at plants with a capacity factor of 60% or less, the generation lost (11.9%) represents only about 5.8% of our current annual electricity demand. In a macro sense, there is sufficient surplus natural gas–fired capacity to compensate for that loss.
If Washington dangles the fuel-switch carrot (via tax credits, grants, and the like), then a few of these borderline plants become candidates for replacement or repowering. Given that scenario, a loss of 50 GW of coal-fired capacity over the next decade is a very reasonable prediction. — Dr. Robert Peltier, PE is POWER’s editor-in-chief. Grant Grothen, PE (ggrothen@burnsmcd.com), a principal for Burns & McDonnell, provided valuable assistance and database information
To see how Klean Industries is developing environmentally friendly, cost effective coal gasification technologies equiped wih the latest technologies and systems please click here.
You can return to the main Market News page, or press the Back button on your browser.

