Municipal Solid Waste Factsheet | United States
Click here to download a printable version » GO.
Municipal Solid Waste (MSW), commonly called “trash” or “garbage,” includes wastes such as durable goods (e.g., tires, furniture), nondurable goods (e.g., newspapers, plastic plates/cups), containers and packaging (e.g., milk cartons, plastic wrap), and other wastes (e.g., yard waste, food). This category of waste generally refers to common household waste, as well as office and retail wastes, but excludes industrial, hazardous, and construction wastes. The handling and disposal of MSW is a growing concern as the volume of waste generated in the U.S. continues to increase.1
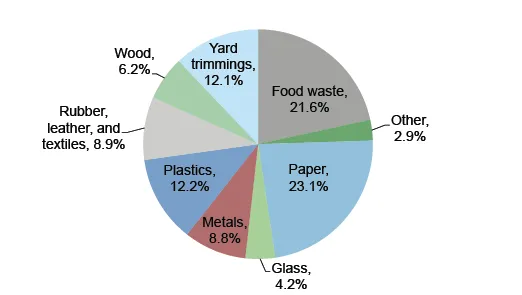
U.S. MSW COMPOSITION, 20181
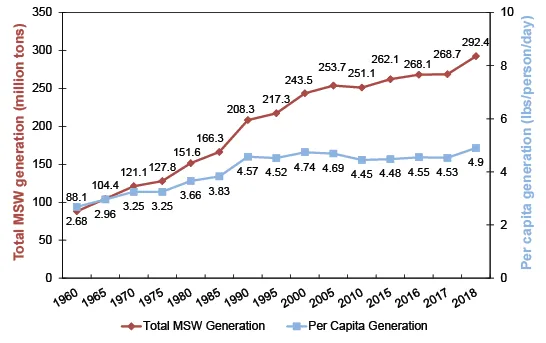
U.S. ANNUAL MSW GENERATION1
Generation Statistics
- Total annual MSW generation in the U.S. has increased by 93% since 1980, to 292 million tons per year in 2018.1
- Per capita MSW generation increased by 34% over the same time period, from 3.7 to 4.9 pounds per person per day.1 For comparison, MSW generation rates (in lbs/person/day) are 2.7 in Sweden, 3.8 in Germany, and 2.8 in the United Kingdom.2 At the current per capita rate, an American weighing 180 pounds generates their own weight in MSW every 37 days.
- In 2018, per capita generation of MSW was 29 pounds per $1,000 of GDP in the U.S., 19 in Sweden, 23 in the UK, and 27 in Germany.3,4
- Packaging, containers, and durable goods made up 48% of MSW generation in 2018. Most of the remainder was split between nondurable goods, food waste, and yard waste.1
Management Methods
Landfill
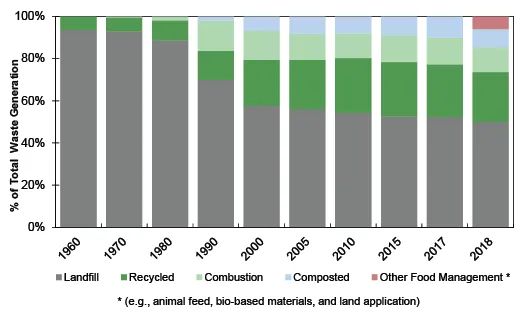
- In 2018, 50% of MSW generated in the U.S. was disposed of in 1,278 landfills.1,5
- The 2020 combined capacity of the two largest landfill corporations in the U.S. was 9.98 billion cubic yards.6
- Landfill disposal (“tipping”) fees in 2020 in the U.S. averaged $53.72 per ton, a 3% decrease from 2019.7 These fees are used as funding for operation and maintenace of landfills, but there is still a lack of funding for research and technologies for waste diversion.8
- Environmental impacts of landfill disposal include loss of land area, emissions of methane (CH4, a greenhouse gas) to the atmosphere, and potential leaching of hazardous materials to groundwater, though proper design reduces this possibility.9,10
- Landfills were the third largest source of U.S. anthropogenic CH4 emissions in 2020, accounting for 109.3 million metric tons CO2-equivalent emissions, about 1.8% of total GHG emissions.9
MSW MANAGEMENT IN THE U.S.1
Image
Combustion
- In 2018, 11.8% of MSW generated in the U.S. was disposed of through waste incineration with energy recovery.1
- Combustion reduces waste by 75-85% by weight and 85-95% by volume, leaving behind a residue called ash. A majority of this ash is landfilled, although recent attempts have been made to reuse the residue.12 In 2020, 65 power plants burned 25 million tons of MSW and generated about 13.5 billion kWh of electricity.13
- Biogenic MSW (paper, food, and yard waste) accounted for 45% (6.08 billion kWh) of the electricity produced, or about 0.15% of total U.S. electricity generation.13,14
- Incineration of MSW generates a variety of pollutants (CO2, heavy metals, dioxins, particulates) that contribute to impacts such as climate change, smog, acidification, and human health impacts (asthma and heart and nervous system damage).15
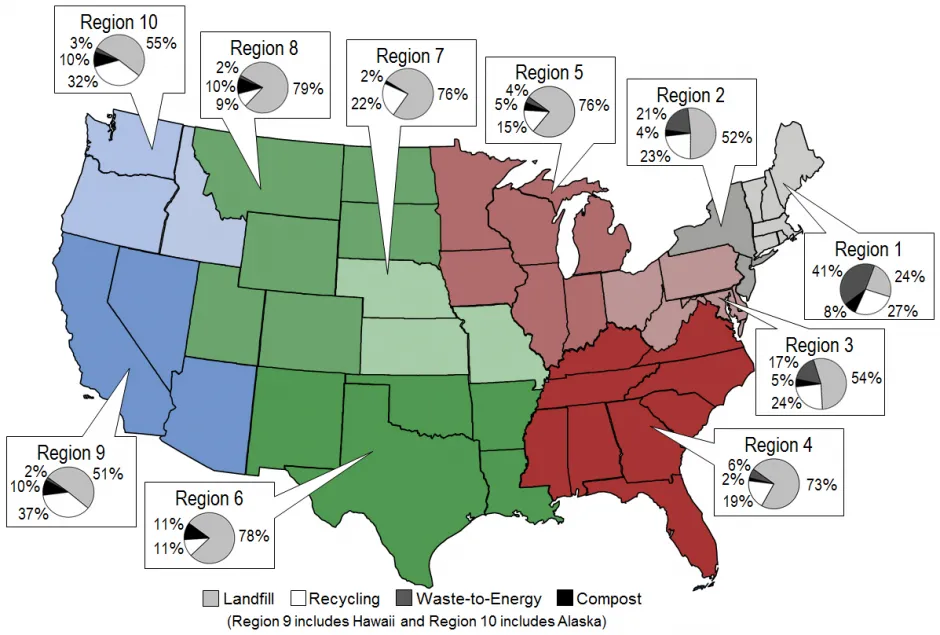
REGIONAL MSW MANAGEMENT, 201011
Recycling and Composting
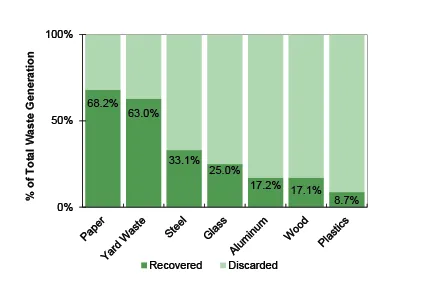
- In 2018, 32.1% of MSW (by weight) generated in the U.S. was recovered for recycling or composting, diverting 93.9 million tons of material from landfills and incinerators—about 2.8 times the amount diverted in 1990.1
- In 2018, 27% of recovered MSW was composted.1
- Only 53% of people in the U.S. are automatically enrolled in recycling programs; 82% of cities with curbside recycling collect material single-stream, meaning materials such as glass and paper are separated at the recycling plant.16,17 The number of curbside programs in the U.S. has increased more than ninefold since 1988.18,19
- In 2018, 97% of corrugated boxes were recovered for recycling in 2018; other highly recycled products include lead-acid batteries (99%), newspapers (65%), major appliances (60%), and aluminum beverage cans (50%).1
- Common products with poor recycling rates include: carpet (9%), small appliances (6%), and furniture (0.3%).20
RECOVERY OF MATERIALS IN MSW, 20181
Solutions and Sustainable Alternatives
Source Reduction
- Source reduction activities help prevent materials from entering the MSW stream and are the most effective way to reduce waste generation.21
- Identify opportunities to reuse materials at home or in your community. Purchase items like furniture and appliances from reuse centers and consignment shops.
- Packaging and containers made up 28% of the MSW generated in 2018. Minimize the volume of packaging material required by selecting efficiently packaged products or buying in bulk.1
- Purchase products with post-consumer recycled content and encourage companies to implement source reduction programs.
- In 2018, 2.5 million tons of paper and plastic plates and cups were disposed of.20 Choose reusable plates, cups, and silverware over disposable goods and reuse them enough times to make up for their greater production burdens compared to disposables.22
- Food waste makes up 21.6% of MSW in the U.S., but only 4.1% is recovered or composted and 28.1% goes through other food management pathways. Reduce food waste through efficient meal planning and composting of scraps.1
Encourage Supportive Public Policy
- Many communities have implemented Pay-As-You-Throw programs, designed to limit the volume of MSW per household by charging residents for waste collection based on the weight they throw away.23
- In 2020, the U.S. Department of Agriculture, Environmental Protection Agency, and Food and Drug Administration renewed the Winning on Reducing Food Waste initiative, continuing the goal to reduce food loss and waste.24
- Implementation of curbside recycling and composting programs can help reduce the burden of waste disposal.
- Although most states restrict landfill disposal of certain materials, some states do not restrict the disposal of potentially hazardous items (e.g., oil, batteries, tires, and electronics).25
- Ten states (CA, CT, HI, IA, ME, MA, MI, NY, OR, and VT) have deposit laws that encourage the return of empty beverage containers for refunds.26
- In June 2021, the U.S. House of Representatives held a hearing to discuss plastic waste reduction and recycling research. The Plastic Waste Reduction and Recycling Research Act was also considered for the role it could play in support of increasing federal investments in plastic waste reduction and recycling R&D, and recycling standards development.27
Center for Sustainable Systems, University of Michigan. 2021. “Municipal Solid Waste Factsheet.” Pub. No. CSS04-15.
You can return to the main Market News page, or press the Back button on your browser.

