
Unites States | Fact & Figures on Materials, Wastes & Recycling
The Current National Picture
EPA began collecting and reporting data on the generation and disposition of waste in the United States more than 35 years ago. The Agency uses this information to measure the success of materials management programs across the country and to characterize the national waste stream. These Facts and Figures are current through the calendar year 2018.
The total generation of municipal solid waste (MSW) in 2018 was 292.4 million tons (U.S. short tons, unless specified) or 4.9 pounds per person per day. Of the MSW generated, approximately 69 million tons were recycled and 25 million tons were composted. Together, almost 94 million tons of MSW were recycled and composted, equivalent to a 32.1 percent recycling and composting rate. An additional 17.7 million tons of food were managed by other methods. Other food management includes the following management pathways: animal feed, bio-based materials/biochemical processing, co-digestion/anaerobic digestion, donation, land application and sewer/wastewater treatment. For more information on food management, check out Food: Material-Specific Data. In addition, nearly 35 million tons of MSW (11.8 percent) were combusted with energy recovery and more than 146 million tons of MSW (50 percent) were landfilled.
EPA refers to trash, or MSW, as various items consumers throw away after they are used. These items include bottles and corrugated boxes, food, grass clippings, sofas, computers, tires, and refrigerators. However, MSW does not include everything that may be landfilled at the local level, such as construction and demolition (C&D) debris, municipal wastewater sludge, and other non-hazardous industrial wastes. While the analysis in Facts and Figures focuses primarily on MSW, EPA has been including estimates of C&D generation and management as a separate non-hazardous waste stream in recent years.
EPA is now in the process of reviewing the waste hierarchy to determine if potential changes should be made based on the latest available data and information. More Information:
- Check out the Facts and Figures methodology.
- Check out our Sustainable Materials Management web area for relevant information and our State Measurement Program page for state-specific information.
 *MSW generation rose considerably from 2017 to 2018 mainly because EPA enhanced its food measurement methodology to more fully account for all the ways wasted food is managed throughout the food system.
Management of MSW continues to be a high priority for state and local governments. This includes the source reduction of wastes before they enter the waste stream and the recovery of generated waste for recycling, composting or other methods. It also includes environmentally sound waste management through combustion with energy recovery and conversion, as well as landfilling practices that meet current standards or newly emerging waste conversion technologies.
EPA developed the non-hazardous materials and waste management hierarchy in recognition that no single waste management approach is suitable for managing all materials and waste streams in all circumstances. The hierarchy ranks the various management strategies from most to least environmentally preferred. The hierarchy places emphasis on reducing, reusing, and recycling as key to sustainable materials management.
Generation
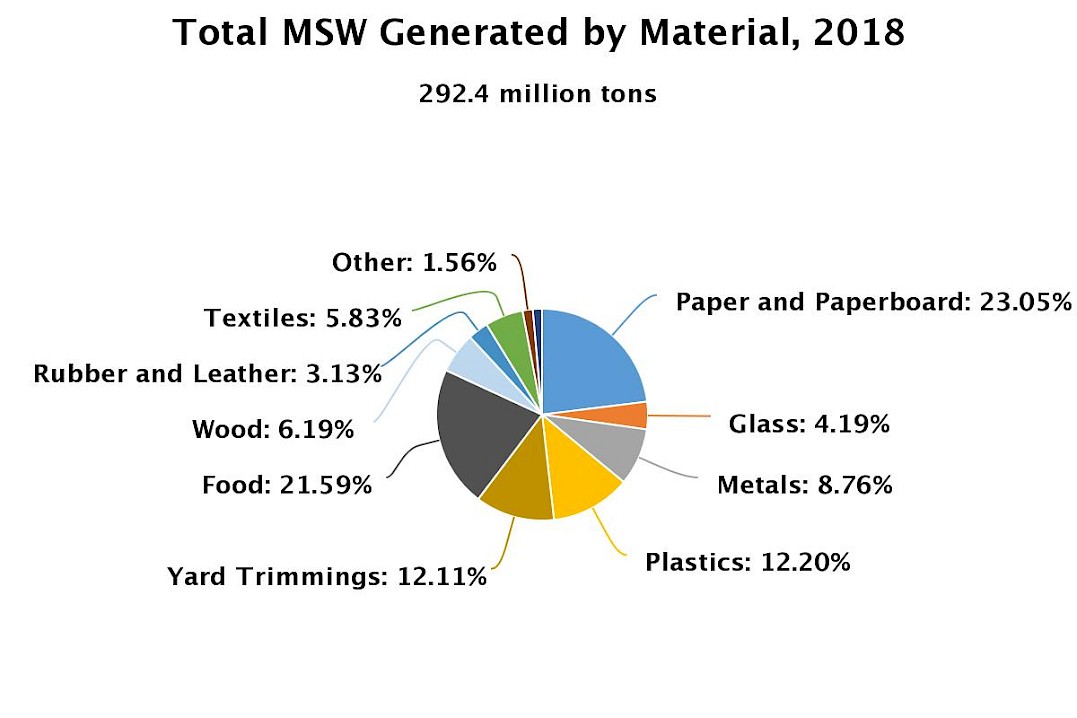
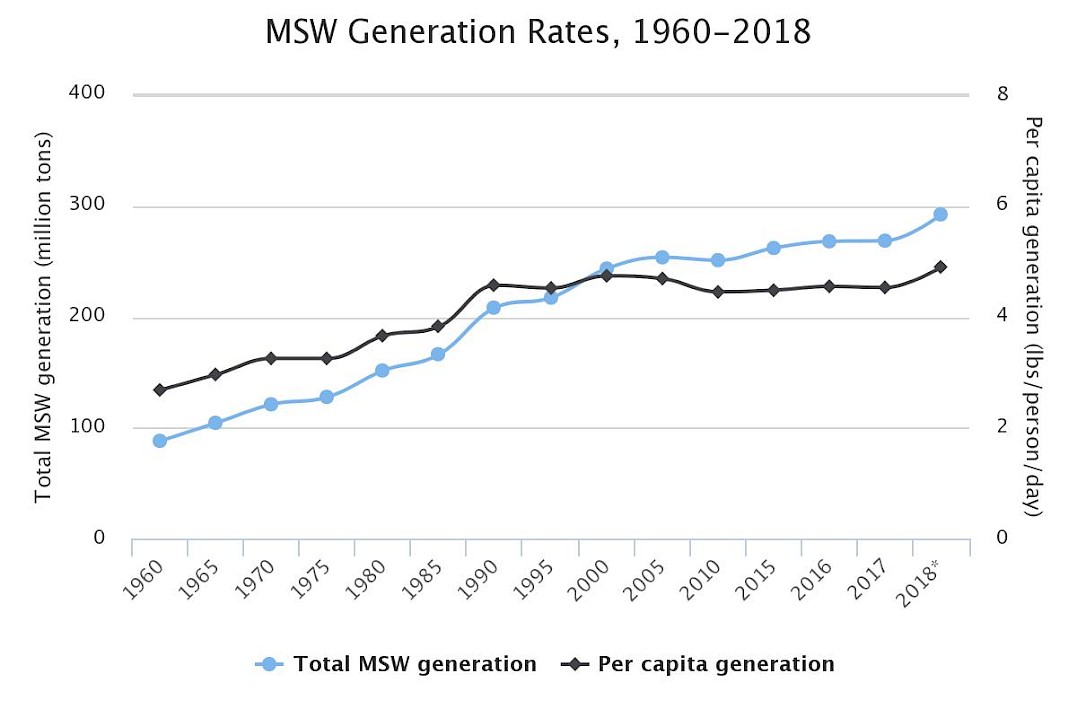
The total generation of MSW in 2018 was 292.4 million tons, which was approximately 23.7 million tons more than the amount generated in 2017. This is an increase from the 268.7 million tons generated in 2017 and the 208.3 million tons in 1990.
*MSW generation rose considerably from 2017 to 2018 mainly because EPA enhanced its food measurement methodology to more fully account for all the ways wasted food is managed throughout the food system.
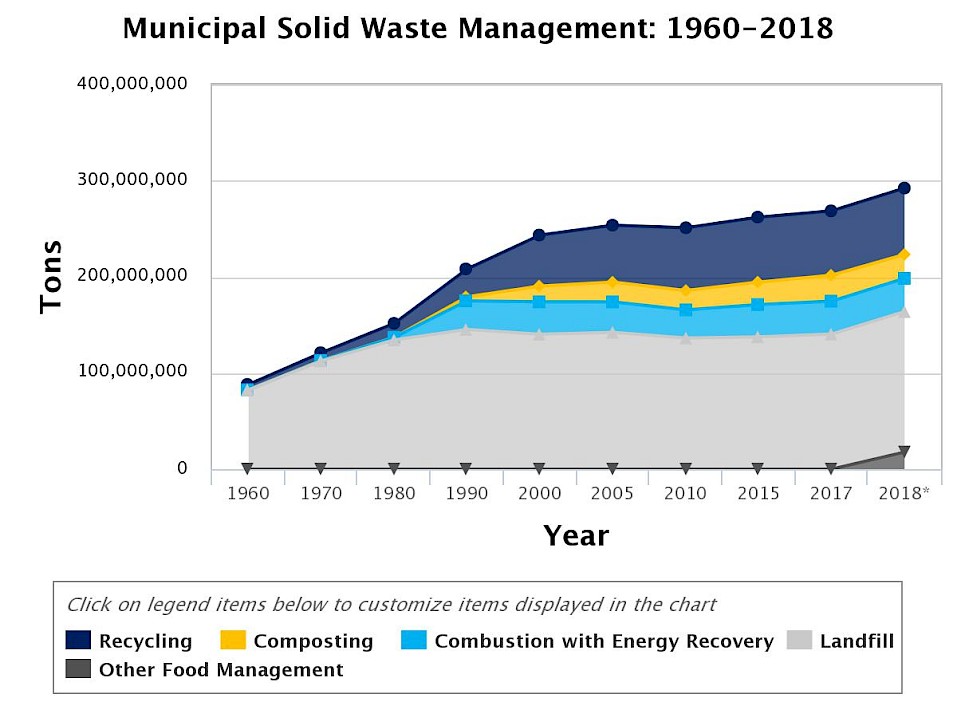
Municipal Solid Waste Management: 1960-2018
Per capita, MSW generation increased from 4.5 pounds per person per day in 2017 to 4.9 pounds per person per day in 2018. The increase from 2017 to 2018 is mainly the result of EPA’s inclusion of additional wasted food management pathways. Check out Food: Material-Specific Data.
Paper and paperboard products made up the largest percentage of all the materials in MSW, at 23.1 percent of total generation. The generation of paper and paperboard products declined from 87.7 million tons in 2000 to 67.4 million tons in 2018. The generation of newspapers has been declining since 2000, and this trend is expected to continue, partly due to decreased page size, but mainly due to the increased digitization of news. The generation of office-type (high-grade) papers also has been in decline, due at least partially to activities such as the increased use of the electronic transmission of reports. Paper and paperboard products have ranged between 28.4 and 23.1 percent of generation since 2010.
Food waste comprised the fourth largest material category, estimated at 63.1 million tons or 21.6 percent of total generation in 2018. Yard trimmings comprised the next largest material category, estimated at 35.4 million tons, or 12.1 percent of total generation, in 2018. This compares to 35 million tons (16.8 percent of total generation) in 1990. The decline in yard trimmings generation since 1990 is largely due to state legislation discouraging yard trimmings disposal in landfills, including source reduction measures such as backyard composting and leaving grass trimmings in the yard.
In 2018, plastic products generation was 35.7 million tons, or 12.2 percent of generation. This was an increase of 4.3 million tons from 2010 to 2018, and it came from durable goods and the containers and packaging categories. Plastic generation has grown from 8.2 percent of generation in 1990 to 12.2 percent in 2018. Plastic generation as a percent of total generation has varied from 12.2 to 13.2 percent over the past eight years.
In 2018, 2.7 million tons of selected consumer electronics were generated, representing less than 1 percent of MSW generation. Selected consumer electronics include products such as TVs, VCRs, DVD players, video cameras, stereo systems, telephones, and computer equipment.
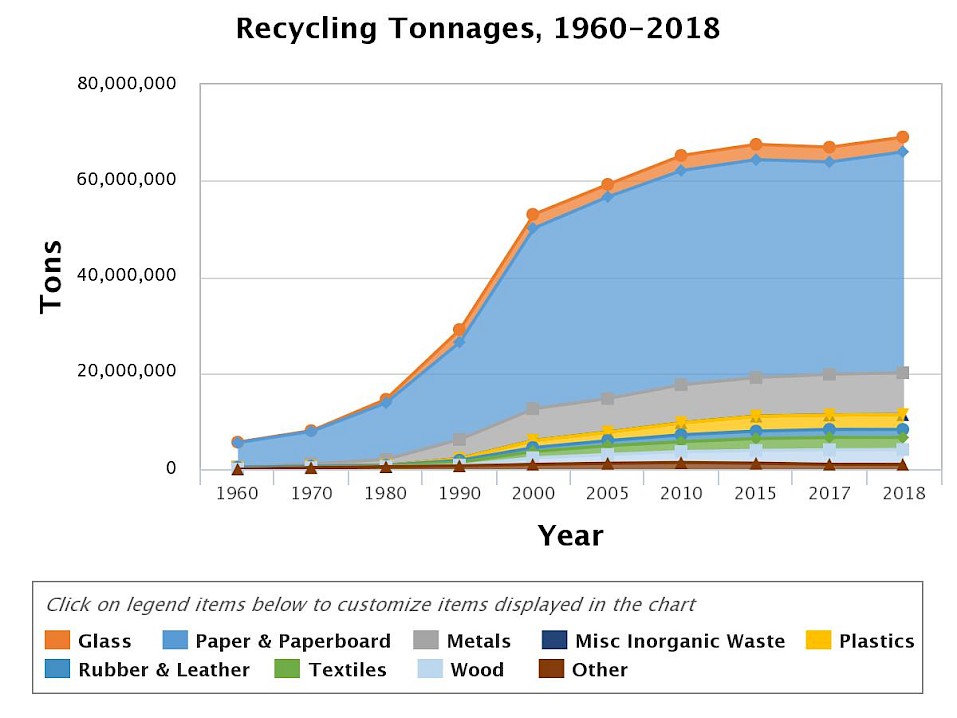
Recycling
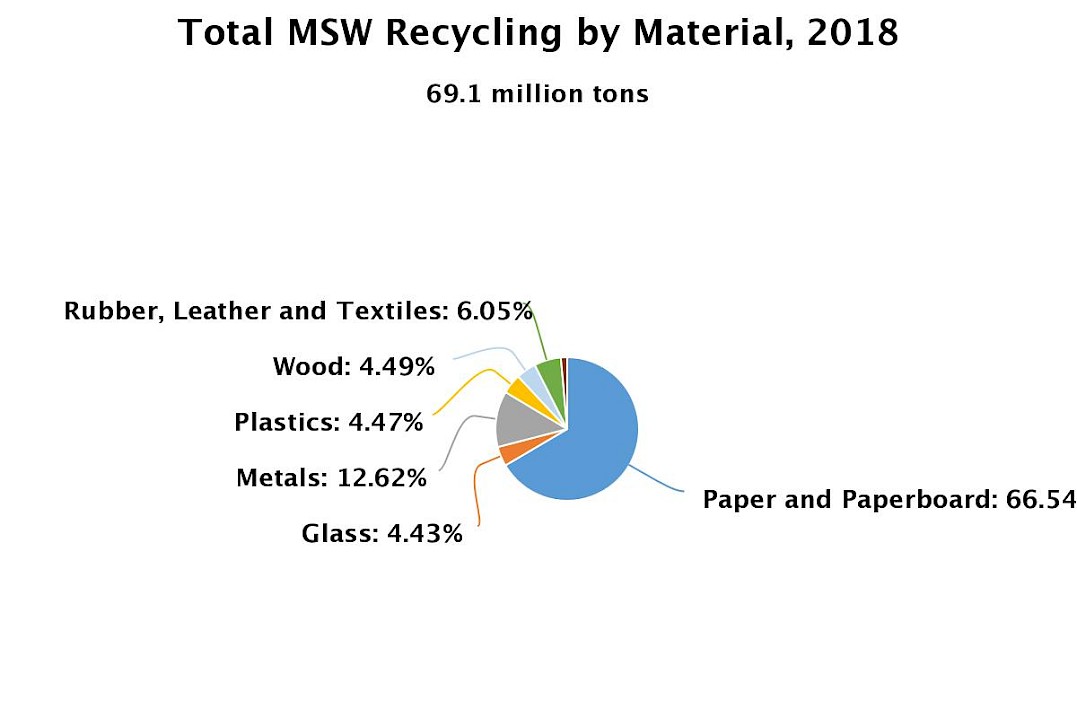
The total MSW recycled was more than 69 million tons, with paper and paperboard accounting for approximately 67 percent of that amount. Metals comprised about 13 percent, while glass, plastic, and wood made up between 4 and 5 percent.
 Measured by tonnage, the most-recycled products, and materials in 2018 were corrugated boxes (32.1 million tons), mixed nondurable paper products (8.8 million tons), newspapers/mechanical papers (3.3 million tons), lead-acid batteries (2.9 million tons), major appliances (3.1 million tons), wood packaging (3.1 million tons), glass containers (3 million tons), tires (2.6 million tons), mixed paper containers and packaging (1.8 million tons) and selected consumer electronics (1 million tons). Collectively, these products accounted for 90 percent of total MSW recycling in 2018.
Check out our Reduce, Reuse, Recycle web area for more information on recycling.
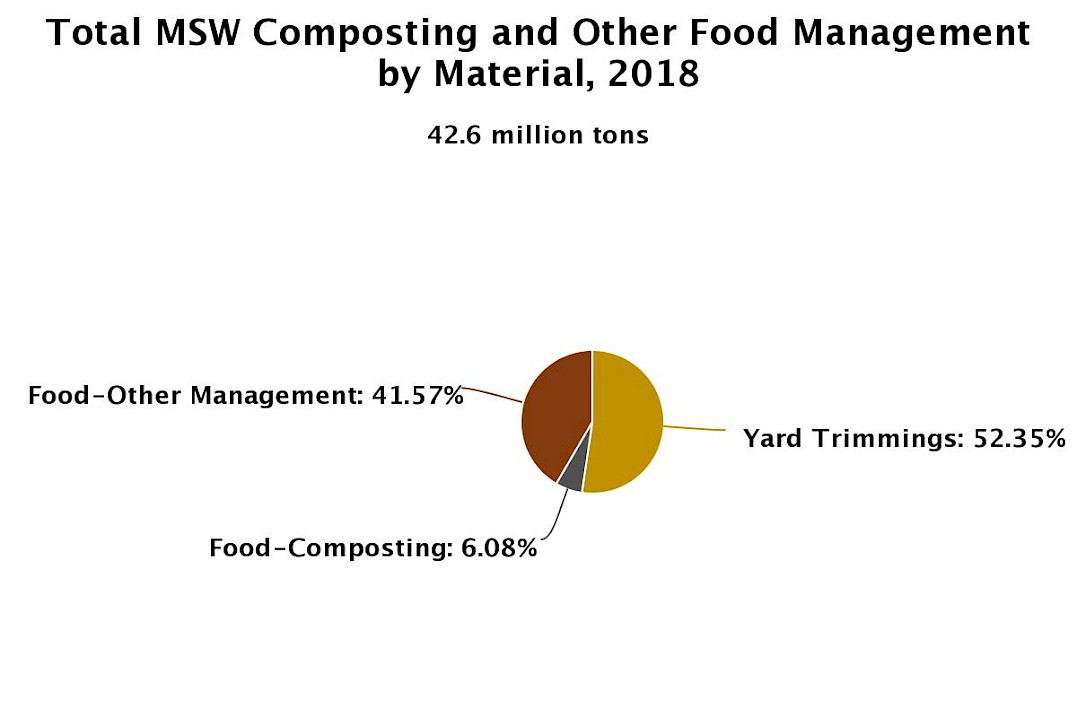
Composting/Other Food Management
The total MSW composted was 25 million tons. This included approximately 22.3 million tons of yard trimmings (more than a five-fold increase since 1990) and 2.6 million tons of food waste (4.1 percent of the generation of wasted food).
Other methods of food management were estimated for the first time in 2018. In 2018, 17.7 million tons of food (28.1 percent of generation of wasted food) was managed through animal feed, co-digestion/anaerobic digestion, bio-based materials/biochemical processing, donation, land application, and sewer/wastewater treatment.
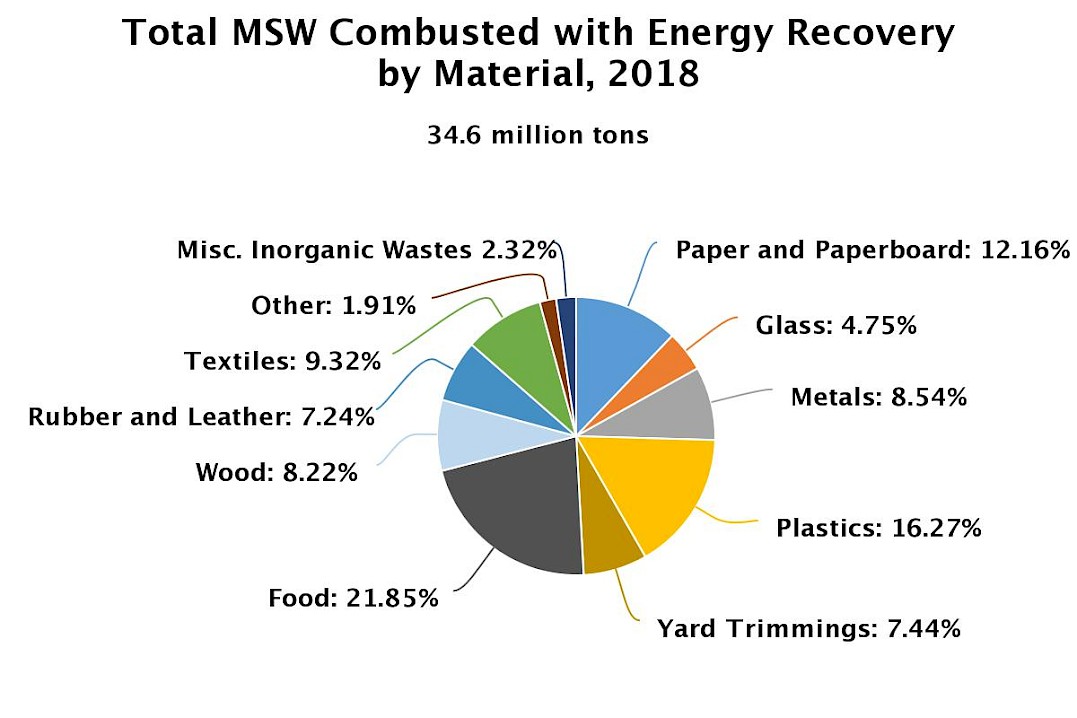
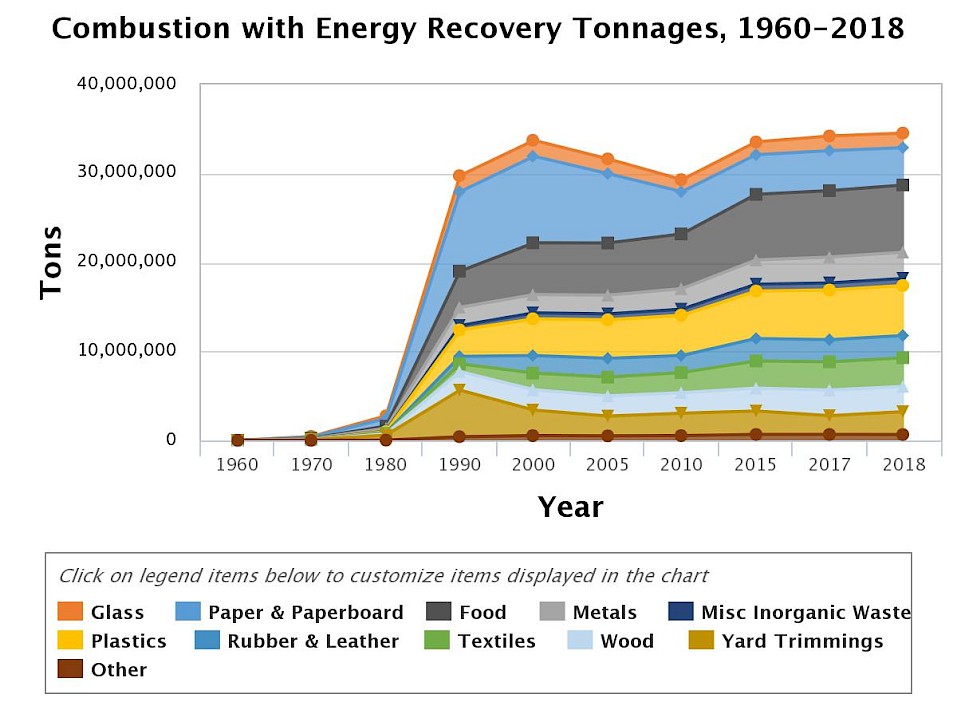
Combustion with Energy Recovery
Check out our Energy Recovery from the Combustion of Municipal Solid Waste (MSW) page for more information.
In 2018, 34.6 million tons of MSW were combusted with energy recovery. Food made up the largest component of MSW combusted at approximately 22 percent. Rubber, leather, and textiles accounted for over 16 percent of MSW combustion. Plastics comprised about 16 percent, and paper and paperboard made up about 12 percent. The other materials accounted for less than 10 percent each.
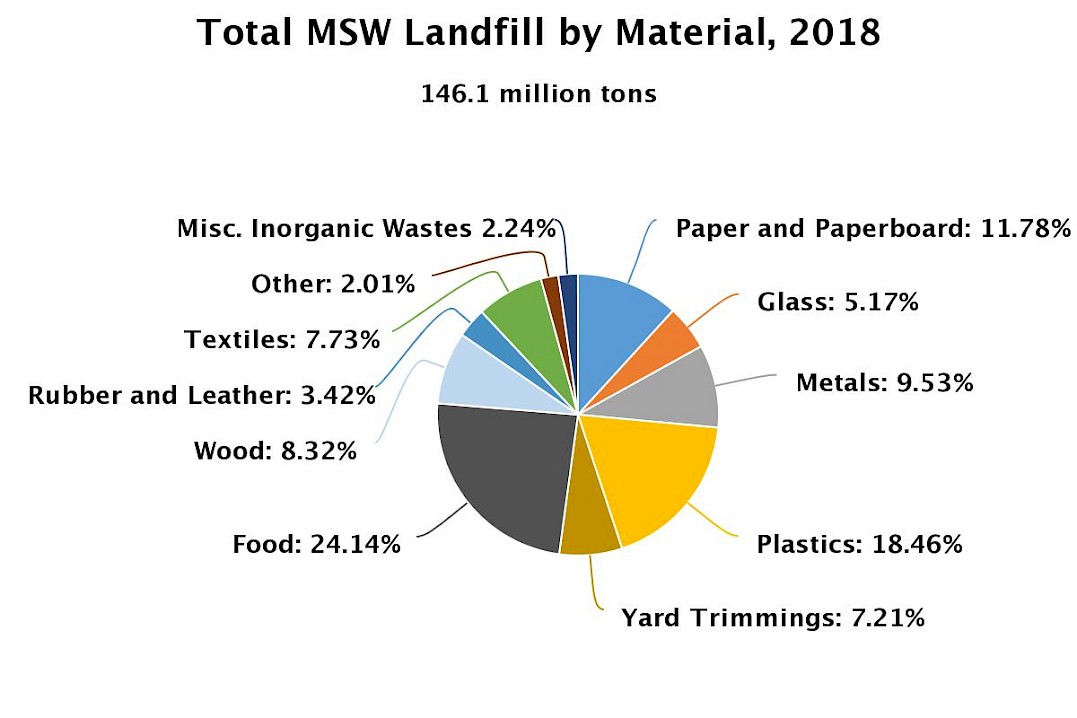
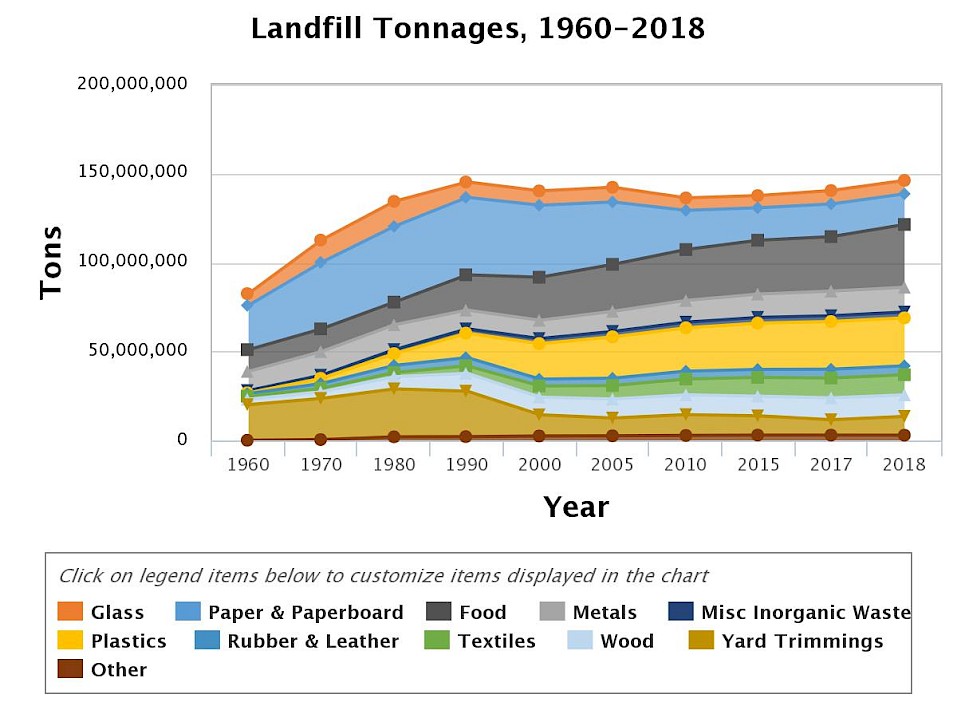
Landfilling
Check out our Municipal Solid Waste Landfills page for more information, and visit our Landfills web area for information on other landfills.
In 2018, about 146.1 million tons of MSW were landfilled. Food was the largest component at about 24 percent. Plastics accounted for over 18 percent, paper and paperboard made up about 12 percent, and rubber, leather, and textiles comprised over 11 percent. Other materials accounted for less than 10 percent each.
Trends – 1960 to Today
In 2018, the amount of MSW generated was 292.4 million tons. The amount of MSW recycled was 69.0 million tons and the amount composted was 24.9 million tons. About 17.7 million tons of food were managed by other methods. The amount of MSW combusted with energy recovery was 34.6 million tons, while the amount of MSW sent to landfills was 146.2 million tons. Presented below are details of these trends:
- Over the last few decades, the generation and management of MSW has changed substantially. Generation of MSW increased (except in recession years) from 88.1 million tons in 1960 to 292.4 million tons in 2018. Generation decreased 1 percent between 2005 and 2010, followed by a rise in generation of 7 percent from 2010 to 2017. Generation rose from 268.7 million tons to 292.4 million tons in 2018, mainly as a result of EPA’s inclusion of additional food management pathways.
- The generation rate in 1960 was just 2.68 pounds per person per day. It increased to 3.66 pounds per person per day in 1980. In 2000, it reached 4.74 pounds per person per day and then decreased to 4.69 pounds per person per day in 2005. The generation rate was 4.9 pounds per person per day in 2018, an 8 percent increase from 2017. The increase from 2017 to 2018 is mainly the result of EPA’s inclusion of additional wasted food management pathways.
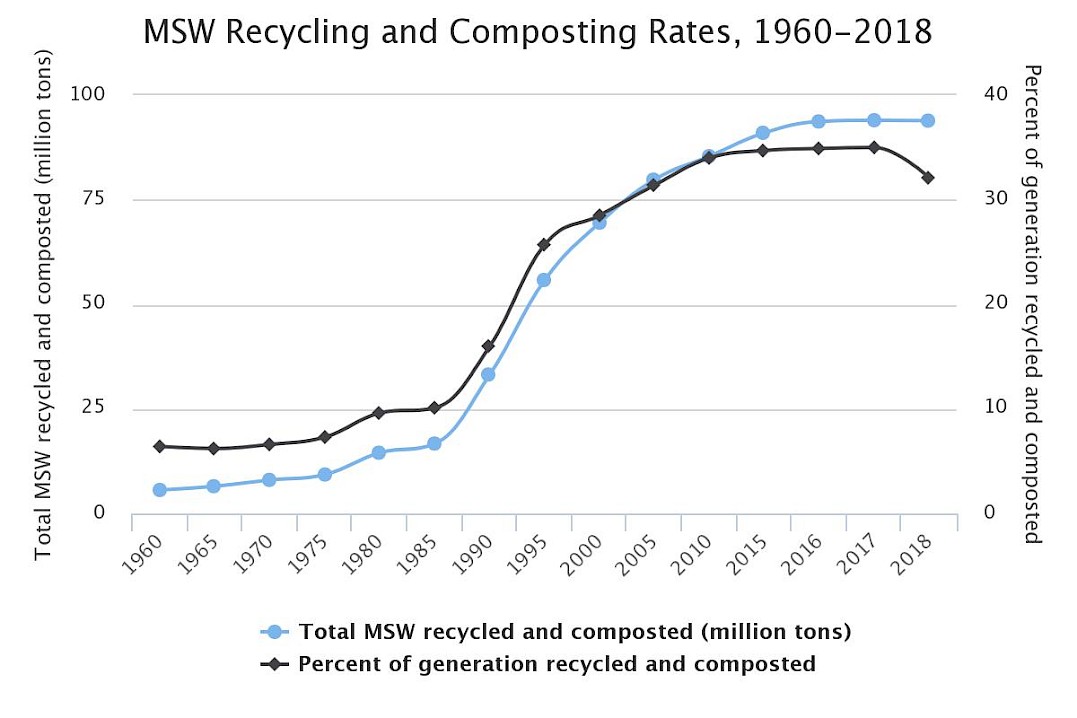
- Over time, recycling and composting rates have increased from just over 6 percent of MSW generated in 1960 to about 10 percent in 1980, to 16 percent in 1990, to about 29 percent in 2000, and to about 35 percent in 2017. It decreased to 32.1 percent in 2018.
- The amount of MSW combusted with energy recovery increased from zero in 1960 to 14 percent in 1990. In 2018, it was about 12 percent.
- Landfilling of waste has decreased from 94 percent of the amount generated in 1960 to 50 percent of the amount generated in 2018.
*MSW generation rose considerably from 2017 to 2018 mainly because EPA enhanced its food measurement methodology to more fully account for all the ways wasted food is managed throughout the food system.
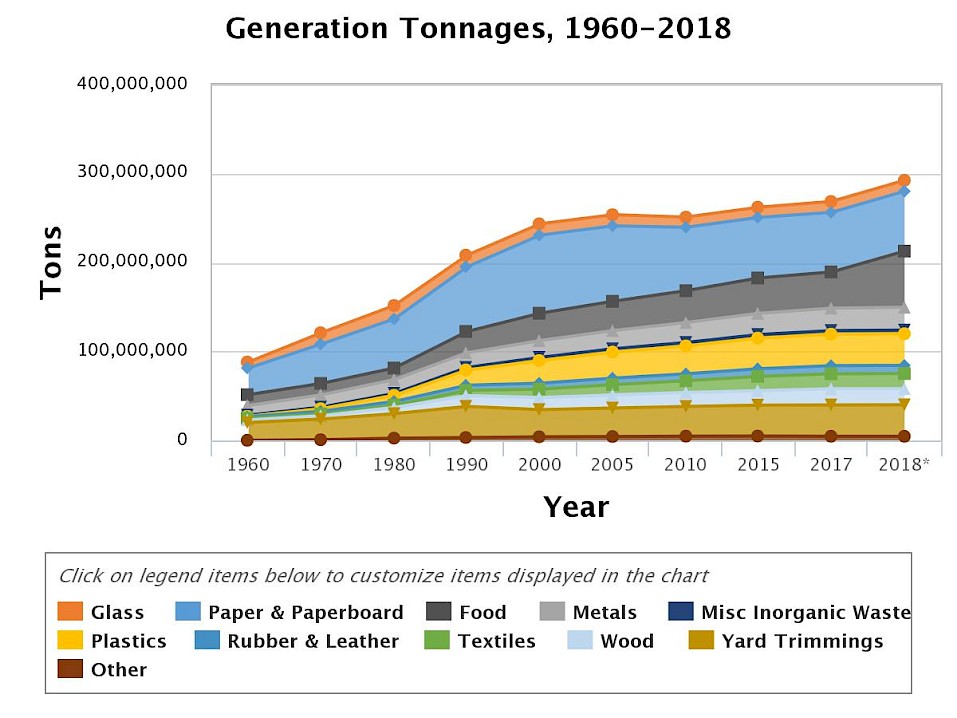
Generation Trends
The generation of paper and paperboard, the largest material component of MSW, fluctuates from year to year but has decreased from 87.7 million tons in 2000 to 67.4 million tons in 2018. The generation of yard trimmings and food waste has increased since 2000. Generation of other material categories fluctuates from year to year, but overall MSW generation increased from 1960 to 2005, with the trend reversing from 2005 to 2010, and rising again from 2010 through 2018.
Recycling and Composting Trends
In the percentage of total MSW generation, recycling (including composting) did not exceed 15 percent until 1990. Growth in the recycling rate was significant over the next 15 years, spanning until 2005. The recycling rate grew more slowly over the last few years. The 2018 recycling rate was 32.1 percent.
The recycling and composting rates (as a percentage of generation) of the below materials in MSW has mostly increased over the last 58 years. Read over the table below for examples.
| 1960 | 1970 | 1980 | 1990 | 2000 | 2005 | 2010 | 2015 | 2017 | 2018 | |
|---|---|---|---|---|---|---|---|---|---|---|
| Paper and Paperboard | 17% | 15% | 21% | 28% | 43% | 50% | 63% | 67% | 66% | 68% |
| Glass | 2% | 1% | 5% | 20% | 23% | 21% | 27% | 28% | 25% | 25% |
| Plastics | Neg. | Neg. | <1% | 2% | 6% | 6% | 8% | 9% | 9% | 9% |
| Yard Trimmings | Neg. | Neg. | Neg. | 12% | 52% | 62% | 58% | 61% | 69% | 63% |
| Lead-acid Batteries | Neg. | 76% | 70% | 97% | 93% | 96% | 99% | 99% | 99% | 99% |
“Neg.” means less than 5,000 tons or 0.05 percent.
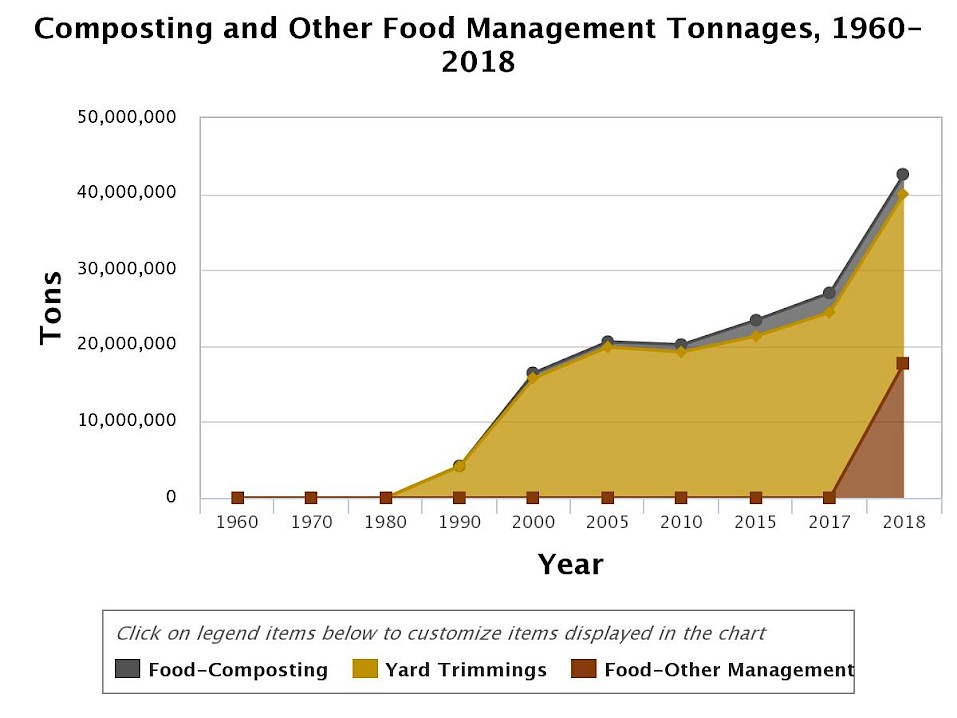
The rate of yard trimmings composting was negligible in 1980, rose to 12 percent in 1990 and 52 percent in 2000. In 2005 it was 62 percent, in 2017 it was 69 percent, and in 2018 it was 63 percent.
Food composting was negligible in 1990, rose to 2.2 percent (680,000 tons) in 2000, 5.3 percent (2.1 million tons) in 2015, and 6.3 percent (2.6 million tons) in 2017. In 2018 the food composting rate was 4.1 percent (2.6 million tons). Due to a change in methodology, there was an increase in the wasted food generation estimate between 2017 and 2018, which resulted in a lower composting rate even though the tons composted remained the same from 2017 to 2018.
Other Food Management Trends
Other food management pathways, estimated for the first time in 2018, were 17.7 million tons (28.1 percent of wasted food generation). These management pathways include animal feed, digestion/anaerobic digestion, bio-based materials/biochemical processing, donation, land application, and sewer/wastewater treatment. Check out the Food: Material-Specific Data web page.
Recycling, Composting, and Other Food Management Trends Specific to 2015-2018
Included in the generation number are the almost 94 million tons of MSW recycled and composted and an additional 17.7 million tons of other food management in 2018. The following provides a detailed breakdown of the numbers:
- 69 million tons of MSW were recycled in 2018, a 2.2 percent increase from the 67.6 million tons recycled in 2015.
- There was an increase from 23.4 million to 24.9 million tons of food and yard trimmings composted between 2015 and 2018.
- The recycling rate (including composting) was 32.1 percent in 2018, down from 34.7 percent in 2015.
- The per capita rates in 2018 were:
- 1.16 pounds per person per day for recycling.
- 0.42 pounds per person per day for composting.
- 0.30 pounds per person per day for other food management.
Listed here are the recycling or composting rates for three categories of materials, including paper and paperboard, yard trimmings, and food:
- In 2018, the rate of paper and paperboard recycling was 68.2 percent (46.0 million tons), up from 65.9 percent in 2017 (44.2 million tons), and up from 42.8 percent in 2000.
- The rate of yard trimmings composted in 2018 was 63 percent (22.3 million tons), down from 69.4 percent (24.4 million tons) in 2017. The rate of yard trimmings composted in 2000 was 51.7 percent.
- In 2018, the rate of food and other MSW organics composting was 4.1 percent (2.6 million tons). Although this is down from 6.3 percent in 2017, the tons composted remained the same between 2017 and 2018 (2.6 million tons). Due to a change in methodology, there was an increase in the wasted food generation estimate between 2017 and 2018, which results in a lower composting rate even though the tons composted remained the same from 2017 to 2018. The rate of food composting was 2.2 percent in the year 2000 (.7 million tons).
Greenhouse Gas Benefits
EPA’s report Sustainable Materials Management: The Road Ahead serves as the foundation for the EPA SMM Program. The recommendations and analytical framework under the Road Ahead encourage the consideration of multiple environmental benefits when developing materials management strategies. Currently, EPA has a tool for estimating greenhouse gas reductions resulting from sustainable materials management – the Waste Reduction Model (WARM). This section shows those GHG reduction environmental benefits. The Agency is developing additional tools to provide information on other environmental benefits and will include these tools and data as they become available.
In 2018, the recycling, composting, combustion with energy recovery, and landfilling of MSW saved over 193 million metric tons of carbon dioxide equivalent (MMTCO2E). This is comparable to the emissions that could be reduced by taking almost 42 million cars off the road in a year.
Paper and paperboard recycling, at about 46 million tons, resulted in the largest portion of the total MSW reduction of over 155 MMTCO2E in 2018. This reduction is equivalent to removing over 33 million cars from the road for one year.
The energy and GHG benefits of recycling, composting, combustion with energy recovery, and landfilling shown in the table below are calculated using the WARM methodology. The estimates of MMTCO2E are calculated using WARM, and identify not only the environmental benefits of recycling, composting, and combustion for energy recovery, but also the benefit of not landfilling materials. Numbers in parentheses indicate a reduction in either greenhouse gases or vehicles and therefore represent environmental benefits.
| Material | Recycled | Composted | Combustion with Energy Recovery | Landfilled | GHG Benefits (MMTCO2E) | Passenger Vehicle Emissions/Year (millions of cars) |
|---|---|---|---|---|---|---|
| Paper and Paperboard | 45.97 | - | 4.20 | 17.22 | (155.17) | (33.52) |
| Glass | 3.06 | - | 1.64 | 7.55 | (0.90) | (0.19) |
| Steel | 6.36 | - | 2.31 | 10.53 | (15.50) | (3.35) |
| Aluminum | 0.67 | - | 0.56 | 2.66 | (6.12) | (1.32) |
| Other Nonferrous Metals** | 1.69 | - | 0.08 | 0.74 | (7.54) | (1.63) |
| Total Metals | 8.72 | - | 2.95 | 13.93 | (29.16) | (6.30) |
| Plastics | 3.09 | - | 5.62 | 26.97 | 4.13 | 0.89 |
| Rubber and Leather† | 1.67 | - | 1.73 | 0.78 | 0.17 | 0.04 |
| Textiles | 2.51 | - | 3.22 | 11.30 | (2.56) | (0.55) |
| Wood | 3.10 | - | 2.84 | 12.15 | (3.30) | (0.71) |
| Food, Other‡ | - | 2.59 | 7.55 | 35.28 | (6.97) | (1.51) |
| Yard Trimmings | - | 22.30 | 2.57 | 10.53 | 0.78 | 0.17 |
| Miscellaneous Inorganic Wastes | - | - | 0.80 | 3.27 | (0.28) | (0.06) |
| Totals | 68.12 | 24.89 | 33.12 | 138.98 | (193.26) | (41.74) |
*Includes material from residential, commercial, and institutional sources (except not industrial process waste).
**Includes lead-acid batteries. Other nonferrous metals are calculated in WARM as mixed metals.
†Only includes rubber from tires.
‡Includes collection of other MSW organics for composting.
These calculations do not include an additional 24.9 million tons of MSW that could not be addressed in the WARM model (including 17.7 million tons from food waste managed by means outside of the scope of the WARM model). MMTCO2E is million metric tons of carbon dioxide equivalent. Details might not add to totals due to rounding.
Source: WARM model Version 15. The number of cars taken off the road/year was calculated using the Greenhouse Gas Equivalency Calculator, updated in March 2020.
On this page:
You can return to the main Market News page, or press the Back button on your browser.