
The State of Canada's Environment
Vancouver, Canada (GLOBE-Net) – The second annual report on Canadian Environmental Sustainability Indicators was released last week and the news is not encouraging. Rising levels of greenhouse gas emissions and smog-forming pollutants and continued degradation of water quality in our lakes and rivers are affecting the health and well-being of Canadians, and threaten the nation’s long-term economic performance. The indicators show that Canada’s economic growth comes with a high environmental cost.
Prepared by Environment Canada, Statistics Canada and Health Canada, the report provides updates on air quality, greenhouse gas emissions and freshwater quality across the country. It shows that between 1990 and 2004, levels of key smog-forming pollutants linked to human health problems are on the rise; Greenhouse gas emissions have skyrocketed to the point that Canada’s emissions per capita are among the highest in the world; and water quality guidelines are not being met at a majority of selected monitoring sites across the country.
Air Quality
Ground level ozone and fine particulate matter were chosen as air quality indicators because they are key components of smog linked to human health. These pollutants can travel into the lungs, causing health problems ranging from minor respiratory discomfort to hospitalizations and for those at high risk, premature death. From 1990 to 2004, national ground-level ozone levels showed an average increase of 0.9% per year. The highest recorded levels in 2004 were in southern Ontario, followed by southern Quebec and eastern Ontario. Southern Ontario was the only region that saw increasing levels since 1990, while ozone in other regions remained relatively stable. For fine particulate matter (particulate matter less than or equal to 2.5 micrometers in diameter), data has only been tracked since 2000 so identifying a trend is not possible. The highest particulate matter levels were again found in southern Ontario, with some areas in eastern Quebec also showing high levels.
Transportation and industrial emissions are the main sources of these air pollutants, but wood burning for home heating is also a significant source, especially in the winter. Dust from wind erosion and ash from forest fires are natural sources of particulate matter.
Health Canada has been particularly interested in ground level ozone and particulate matter components of smog because there are no established thresholds below which these pollutants are safe and do not pose a risk to human health. Efforts are underway to establish an indicator which would link air pollution levels to human health risks, combining ground-level ozone, particulate matter, nitrogen oxide and sulphur dioxide data with information on deaths and hospitalizations due to respiratory problems.
Water quality
The report indicates that water quality in Canada is under severe pressure from a range of sources, including human settlement, agriculture and industrial activities, and that degraded water quality is affecting both aquatic life and human uses of water.
Of the 340 sites tested across southern Canada, 56% of freshwater rivers and lakes did not meet basic water quality guidelines at least some of the time, sometimes failing by a considerable amount. Sites rated as marginal or poor - nearly one-quarter of all sites – failed to meet basic standards most of the time.
The freshwater indicator gauges the ability of surface waters to support aquatic life, but does not measure safety for human consumption. Ratings were assigned to each location based on the Water Quality Index endorsed by the Canadian Council of Ministers of the Environment (CCME). For sites in Southern Canada, observations from 2002 to 2004 rated water quality as excellent at 17 sites (5%) good at 134 sites (39%), fair at 115 sites (34%), marginal at 58 sites (17%) and poor at 16 sites (5%). Freshwater quality at 30 sites across Northern Canada was rated as “good” or “excellent” at 67% of the sites, “fair” at 20% and “marginal” or “poor” at 13%.
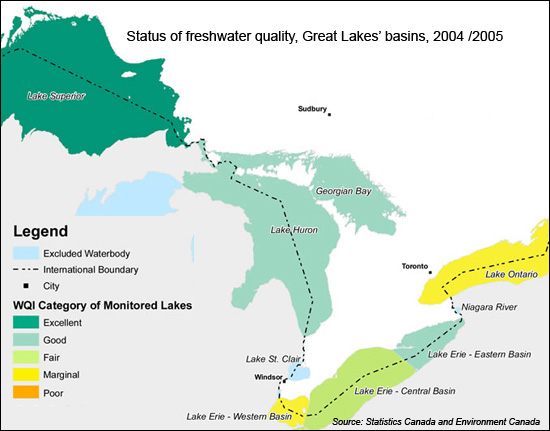
The Great Lakes were sampled extensively and at numerous locations due to their importance to national water supply and proximity to population and industry. In 2004 and 2005 in the Great Lakes was rated as “good” or “excellent” for Lake Superior, Lake Huron, Georgian Bay, and eastern Lake Erie, “fair” for central Lake Erie, and “marginal” for western Lake Erie and all of Lake Ontario, including the areas in and around Toronto.
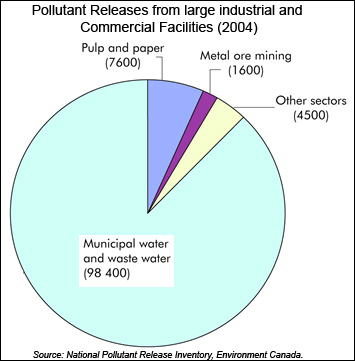
At least 110 000 tonnes of pollutants were directly discharged to Canada’s surface waters (both freshwater and coastal) in 2004, according to Environment Canada data. The most common pollutants by volume were nitrate ion and ammonia, while highly toxic substances such as mercury were released in much smaller, but still significant amounts. Reported sources of pollution clearly show that Canada’s cities and towns are responsible for the vast majority of surface water discharges.
Greenhouse gas emissions
Canada’s annual national greenhouse gas emissions increased 27% from 1990 to 2004 to an estimated 758 million tonnes of carbon dioxide equivalent. This exceeds the greenhouse gas reduction target of the Kyoto Protocol by 35% (or about 200 million tonnes). To put this in perspective, a typical mid-sized car driven 20,000 km a year produces about five tonnes of carbon dioxide.
Canadians actually emitted more greenhouse gases per capita in 2004 than in 1990, as annual emissions per person rose 10% over that period to reach 24 tonnes. Canada is one of the world’s highest per capita emitters, behind only Australia and slightly higher than the United States, producing approximately 2% of global greenhouse gases with only 0.5% of the world’s population.
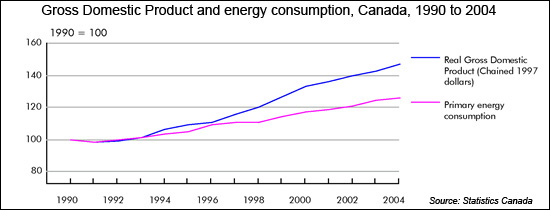
Canada’s emissions intensity, measured as emissions per unit of economic output, or GDP, has improved by 14% since 1990. Canada has become more efficient, but economic and population growth means that total emissions have risen sharply.
Energy consumption (including road transportation, oil and gas industries and fossil fuel-fired electricity generation) rose by around 25 percent between 1990 and 2004. Energy accounted for 82% of total Canadian emissions in 2004 and 91% of the growth in emissions from 1990 to 2004. Greenhouse gas emissions from the oil, gas and coal industry increased 49% from 1990 to 2004, reflecting rapid growth in the production and export of crude oil and natural gas. Emissions from road transportation rose 36% over the same period as the types of personal vehicles shifted from automobiles to minivans, sport utility vehicles and small pickup trucks.
Emissions from thermal electricity and heat production grew 37% from 1990 to 2004, driven primarily by a rising demand for electricity and an increase in the use of fossil fuels for electricity generation relative to non-emitting sources such as nuclear and hydro.
However, analysis of 2002 data suggests that 46% of Canadian industrial greenhouse gas emissions in that year can be attributed to exports, reflecting Canada’s resource and energy-based economy.
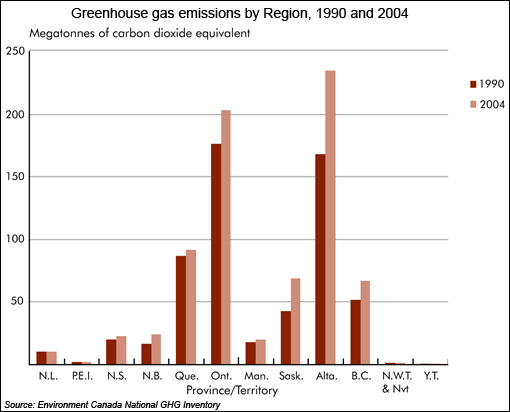
Alberta and Ontario had the highest emissions of all provinces in 2004.
What does this mean for Canada?
As is noted in the Statistics Canada report, the period between 1990 and 2004 saw an increase in many economic and social activities that contributed to increased air and water pollution and to greater amounts of greenhouse gas emissions. During this time period, for example, real gross domestic product increased by 47%, and the population grew by 15%. Primary energy production also rose 44% since 1990, largely as a result of increases in the production of natural gas and crude oil.
Another point stressed in the report is the socio-economic costs of pollution. Health Canada estimates, based on data from eight cities that 5900 premature deaths occur each year in Canada due to air pollution. Economists have also tried to estimate the social costs of poor health due to air pollution in Canada. A monetary estimate of these impacts, including health care costs, lost productivity, and pain and suffering, runs to the billions of dollars annually.
Direct costs associated with reducing greenhouse gas emissions and water and air pollution also have risen. Canadian companies have substantially increased their spending to protect the environment with investments by primary and manufacturing industries reaching $6.8 billion in 2002, a 24% increase over expenditures in 2000. Much of this increase resulted from responses to new environmental regulations and industry’s effort to reduce air emissions such as greenhouse gases.
What can be done?
Canadians like to think of themselves as environmental stewards, and Canada is perceived as such in many parts of the world. The truth is that Canadians produce more air and water pollution per person than nearly all other countries. Canada’s incredible natural capital of forests, rivers, and biodiversity allows us to maintain a high standard of environmental quality, but that is under threat as we continue to slowly degrade our environment.
On the other hand, Canadians have also shown a strong commitment to sustainability and as a nation we have demonstrated our capacity to develop energy efficient technologies and innovative solutions to environmental problems.
By leveraging our natural resources and human capital, Canada could become a worldwide leader in environmental protection, and could stimulate our economy by taking advantage of the booming ‘clean technology’ market, which has been the fastest rising investment sector in recent years.
Canada holds a strong position in several areas: hydrogen and fuel cells, carbon capture and sequestration, and sustainable engineering. Recent trade data reveals that Canada remains a net importer of environmental technologies, and there is considerable room for improvement even to remove this deficit.
To improve Canada’s environment and to build a more sustainable economy more investment is required in clean energy and environmental protection technologies, and strong leadership is required both from governments and the private sector.
Read the Canadian Environmental Sustainability Indicators.
Prepared by Environment Canada, Statistics Canada and Health Canada, the report provides updates on air quality, greenhouse gas emissions and freshwater quality across the country. It shows that between 1990 and 2004, levels of key smog-forming pollutants linked to human health problems are on the rise; Greenhouse gas emissions have skyrocketed to the point that Canada’s emissions per capita are among the highest in the world; and water quality guidelines are not being met at a majority of selected monitoring sites across the country.
Air Quality
Ground level ozone and fine particulate matter were chosen as air quality indicators because they are key components of smog linked to human health. These pollutants can travel into the lungs, causing health problems ranging from minor respiratory discomfort to hospitalizations and for those at high risk, premature death. From 1990 to 2004, national ground-level ozone levels showed an average increase of 0.9% per year. The highest recorded levels in 2004 were in southern Ontario, followed by southern Quebec and eastern Ontario. Southern Ontario was the only region that saw increasing levels since 1990, while ozone in other regions remained relatively stable. For fine particulate matter (particulate matter less than or equal to 2.5 micrometers in diameter), data has only been tracked since 2000 so identifying a trend is not possible. The highest particulate matter levels were again found in southern Ontario, with some areas in eastern Quebec also showing high levels.
Transportation and industrial emissions are the main sources of these air pollutants, but wood burning for home heating is also a significant source, especially in the winter. Dust from wind erosion and ash from forest fires are natural sources of particulate matter.
Health Canada has been particularly interested in ground level ozone and particulate matter components of smog because there are no established thresholds below which these pollutants are safe and do not pose a risk to human health. Efforts are underway to establish an indicator which would link air pollution levels to human health risks, combining ground-level ozone, particulate matter, nitrogen oxide and sulphur dioxide data with information on deaths and hospitalizations due to respiratory problems.
Water quality
The report indicates that water quality in Canada is under severe pressure from a range of sources, including human settlement, agriculture and industrial activities, and that degraded water quality is affecting both aquatic life and human uses of water.
Of the 340 sites tested across southern Canada, 56% of freshwater rivers and lakes did not meet basic water quality guidelines at least some of the time, sometimes failing by a considerable amount. Sites rated as marginal or poor - nearly one-quarter of all sites – failed to meet basic standards most of the time.
The freshwater indicator gauges the ability of surface waters to support aquatic life, but does not measure safety for human consumption. Ratings were assigned to each location based on the Water Quality Index endorsed by the Canadian Council of Ministers of the Environment (CCME). For sites in Southern Canada, observations from 2002 to 2004 rated water quality as excellent at 17 sites (5%) good at 134 sites (39%), fair at 115 sites (34%), marginal at 58 sites (17%) and poor at 16 sites (5%). Freshwater quality at 30 sites across Northern Canada was rated as “good” or “excellent” at 67% of the sites, “fair” at 20% and “marginal” or “poor” at 13%.
The Great Lakes were sampled extensively and at numerous locations due to their importance to national water supply and proximity to population and industry. In 2004 and 2005 in the Great Lakes was rated as “good” or “excellent” for Lake Superior, Lake Huron, Georgian Bay, and eastern Lake Erie, “fair” for central Lake Erie, and “marginal” for western Lake Erie and all of Lake Ontario, including the areas in and around Toronto.
At least 110 000 tonnes of pollutants were directly discharged to Canada’s surface waters (both freshwater and coastal) in 2004, according to Environment Canada data. The most common pollutants by volume were nitrate ion and ammonia, while highly toxic substances such as mercury were released in much smaller, but still significant amounts. Reported sources of pollution clearly show that Canada’s cities and towns are responsible for the vast majority of surface water discharges.
Greenhouse gas emissions
Canada’s annual national greenhouse gas emissions increased 27% from 1990 to 2004 to an estimated 758 million tonnes of carbon dioxide equivalent. This exceeds the greenhouse gas reduction target of the Kyoto Protocol by 35% (or about 200 million tonnes). To put this in perspective, a typical mid-sized car driven 20,000 km a year produces about five tonnes of carbon dioxide.
Canadians actually emitted more greenhouse gases per capita in 2004 than in 1990, as annual emissions per person rose 10% over that period to reach 24 tonnes. Canada is one of the world’s highest per capita emitters, behind only Australia and slightly higher than the United States, producing approximately 2% of global greenhouse gases with only 0.5% of the world’s population.
Canada’s emissions intensity, measured as emissions per unit of economic output, or GDP, has improved by 14% since 1990. Canada has become more efficient, but economic and population growth means that total emissions have risen sharply.
Energy consumption (including road transportation, oil and gas industries and fossil fuel-fired electricity generation) rose by around 25 percent between 1990 and 2004. Energy accounted for 82% of total Canadian emissions in 2004 and 91% of the growth in emissions from 1990 to 2004. Greenhouse gas emissions from the oil, gas and coal industry increased 49% from 1990 to 2004, reflecting rapid growth in the production and export of crude oil and natural gas. Emissions from road transportation rose 36% over the same period as the types of personal vehicles shifted from automobiles to minivans, sport utility vehicles and small pickup trucks.
Emissions from thermal electricity and heat production grew 37% from 1990 to 2004, driven primarily by a rising demand for electricity and an increase in the use of fossil fuels for electricity generation relative to non-emitting sources such as nuclear and hydro.
However, analysis of 2002 data suggests that 46% of Canadian industrial greenhouse gas emissions in that year can be attributed to exports, reflecting Canada’s resource and energy-based economy.
Alberta and Ontario had the highest emissions of all provinces in 2004.
What does this mean for Canada?
As is noted in the Statistics Canada report, the period between 1990 and 2004 saw an increase in many economic and social activities that contributed to increased air and water pollution and to greater amounts of greenhouse gas emissions. During this time period, for example, real gross domestic product increased by 47%, and the population grew by 15%. Primary energy production also rose 44% since 1990, largely as a result of increases in the production of natural gas and crude oil.
Another point stressed in the report is the socio-economic costs of pollution. Health Canada estimates, based on data from eight cities that 5900 premature deaths occur each year in Canada due to air pollution. Economists have also tried to estimate the social costs of poor health due to air pollution in Canada. A monetary estimate of these impacts, including health care costs, lost productivity, and pain and suffering, runs to the billions of dollars annually.
Direct costs associated with reducing greenhouse gas emissions and water and air pollution also have risen. Canadian companies have substantially increased their spending to protect the environment with investments by primary and manufacturing industries reaching $6.8 billion in 2002, a 24% increase over expenditures in 2000. Much of this increase resulted from responses to new environmental regulations and industry’s effort to reduce air emissions such as greenhouse gases.
What can be done?
Canadians like to think of themselves as environmental stewards, and Canada is perceived as such in many parts of the world. The truth is that Canadians produce more air and water pollution per person than nearly all other countries. Canada’s incredible natural capital of forests, rivers, and biodiversity allows us to maintain a high standard of environmental quality, but that is under threat as we continue to slowly degrade our environment.
On the other hand, Canadians have also shown a strong commitment to sustainability and as a nation we have demonstrated our capacity to develop energy efficient technologies and innovative solutions to environmental problems.
By leveraging our natural resources and human capital, Canada could become a worldwide leader in environmental protection, and could stimulate our economy by taking advantage of the booming ‘clean technology’ market, which has been the fastest rising investment sector in recent years.
Canada holds a strong position in several areas: hydrogen and fuel cells, carbon capture and sequestration, and sustainable engineering. Recent trade data reveals that Canada remains a net importer of environmental technologies, and there is considerable room for improvement even to remove this deficit.
To improve Canada’s environment and to build a more sustainable economy more investment is required in clean energy and environmental protection technologies, and strong leadership is required both from governments and the private sector.
Read the Canadian Environmental Sustainability Indicators.
You can return to the main Market News page, or press the Back button on your browser.