
China's Growth Fuels Boom in World Shipping Traffic
Ship traffic on the world’s oceans has quadrupled over the past two decades, according to a new study that’s the first to rely on satellite data to produce global maps of shipping on the open seas.
The data for the study, which was published on November 17 in Geophysical Research Letters, came from a series of satellites that carried radar altimeters, devices that measure the height of the sea’s surface at a given location by bouncing a radar beam off it. The data had been used primarily to measure sea-level rise, ocean currents, and even the topography of the ocean floor. But the radar echoes can also pinpoint the location of icebergs—and ships.
“As we processed all the archives of the altimeter missions for the iceberg studies, we realized that it can also be used to study the evolution of ship traffic,” says study author Jean Tournadre, a researcher at the French Research Institute for Exploitation of the Sea in Brittany.
Tournadre’s study reveals that ship traffic—and the environmental impact that goes with it—has been booming even faster than the volume of international trade. “The main point,” he says “was to show where growth is important and where it can have a potential impact on both the sea and the atmosphere.”
Bustling Waters
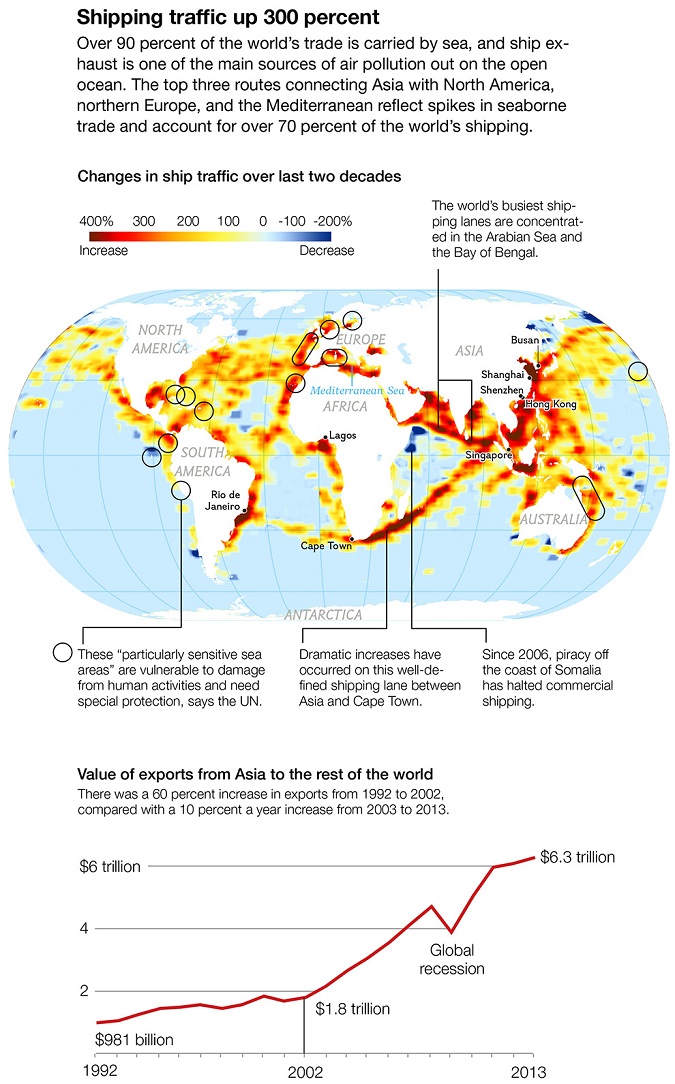
Tournadre used a sample of more than 300,000 ship signatures recorded by the altimeters from 1992 to 2012—a fraction of the total traffic—to map year-to-year changes in the density of ship traffic. He found that traffic increased by about 6 percent a year in the first decade, then soared by 10 percent annually after 2002.
Since ships haul 90 percent of world trade, the changes in ship traffic reflect changes in the global economy, especially the rising importance of Asia. Although the Atlantic Ocean’s share of global traffic dropped from nearly 40 percent in 1992 to 32 percent in 2012, the Pacific’s share rose from 35 to 39 percent.
Meanwhile, ship traffic on the Indian Ocean and China Sea now make up 25 to 30 percent of global traffic, up from 17 percent in 1992.
China drives most of the region’s traffic. According to United Nations Conference on Trade and Development (UNCTAD), it’s now the world’s largest importer of dry bulk commodities such as coal and iron ore, mostly from Brazil and Australia, as well as of crude oil, from the Gulf states. China’s role as Africa’s biggest single trade partner is reflected in the dramatic rise in traffic along the Cape route, between Asia and South Africa.
“The Indian Ocean and China Seas are directly falling under the ‘China effect,’ ” says Cesar Ducruet, who researches global vessel movement at the French National Center for Scientific Research in Paris.
Demand from China as well as other Asian economies, he says, has made the Suez route between Europe and Asia the busiest in the world. The Suez route stretches across the Indian Ocean to the Suez Canal, passing through hubs in Singapore, Sri Lanka, Egypt, Italy, and Spain.
“On the Pacific side, America is a significant market, but just a single one. On the Suez route you get access to several markets at once—Europe, the Middle East, and Africa,” says Jean-Paul Rodrigue, a professor of transportation geography at Hofstra University in Hempstead, New York.
An Oversize World Fleet
Although the volume of international seaborne trade more than doubled between 1992 and 2012, from 4.2 billion tons to 9.2 billion tons, that’s only half the increase Tournadre observed in ship traffic—a discrepancy he finds surprising though not inexplicable.
For one thing, he says, a small part of the traffic increase may not be real. Ships have gotten much bigger over the past two decades, and so they’re more likely to be detected by satellite altimeters.
More important is an increase in the number of ships, which has led to a bloated global fleet. Following what UNCTAD calls the “largest shipbuilding cycle in history,” the carrying capacity of the world’s ships more than doubled between 1992 and 2012, from 695 million deadweight tons to 1.6 billion.
“It is now clear that many of the biggest shipowners invested too much in new ships,” says Ducruet, “thus leading to overcapacity, especially in times of falling demand.”
Because of that excess capacity, says Tournadre, individual ships are carrying less cargo than before and “slow steaming,” or cruising at slower speeds to cut fuel costs.
Finally, Tournadre says, though commercial cargo vessels make up the lion’s share of all ships, fishing boats, military vessels, and oil-rig supply ships also have contributed to the rise in traffic. “For example,” he says, “there is strong traffic growth off of Brazil, related to the development of offshore oil.”
Booming Emissions
Commercial vessels emit a variety of pollutants, and of them, perhaps the greatest source of concern is nitrogen dioxide—a compound that causes respiratory problems, soil and water acidification, and ozone formation. On satellite maps of nitrogen dioxide emissions, some of the main shipping lanes show up as clearly as they do on Tournadre’s maps.
“Since the early ’90s, NO₂ nitrogen dioxide pollution from ships as observed by satellite has increased significantly, in line with the reported increase in number of ships and volume of transported goods,” notes atmospheric scientist Andreas Richter of the Institute of Environmental Physics in Bremen, Germany.
Emissions from vessels headed to and from the Suez Canal are among the top sources of pollution in Egypt and Saudi Arabia, Richter says. Globally, shipping now accounts for 15 to 30 percent of nitrogen dioxide emissions.
Of course, ships also affect the ocean—through collisions with marine life, oil spills, the introduction of invasive species, waste discharges, and noise pollution, to name just a few of the impacts listed by the International Union for Conservation of Nature. The intensifying red lines on Tournadre’s maps document the global shipping boom, he says, but also “the increased human pressure on the open ocean.”
The data for the study, which was published on November 17 in Geophysical Research Letters, came from a series of satellites that carried radar altimeters, devices that measure the height of the sea’s surface at a given location by bouncing a radar beam off it. The data had been used primarily to measure sea-level rise, ocean currents, and even the topography of the ocean floor. But the radar echoes can also pinpoint the location of icebergs—and ships.
“As we processed all the archives of the altimeter missions for the iceberg studies, we realized that it can also be used to study the evolution of ship traffic,” says study author Jean Tournadre, a researcher at the French Research Institute for Exploitation of the Sea in Brittany.
Tournadre’s study reveals that ship traffic—and the environmental impact that goes with it—has been booming even faster than the volume of international trade. “The main point,” he says “was to show where growth is important and where it can have a potential impact on both the sea and the atmosphere.”
Bustling Waters
Tournadre used a sample of more than 300,000 ship signatures recorded by the altimeters from 1992 to 2012—a fraction of the total traffic—to map year-to-year changes in the density of ship traffic. He found that traffic increased by about 6 percent a year in the first decade, then soared by 10 percent annually after 2002.
Since ships haul 90 percent of world trade, the changes in ship traffic reflect changes in the global economy, especially the rising importance of Asia. Although the Atlantic Ocean’s share of global traffic dropped from nearly 40 percent in 1992 to 32 percent in 2012, the Pacific’s share rose from 35 to 39 percent.
Meanwhile, ship traffic on the Indian Ocean and China Sea now make up 25 to 30 percent of global traffic, up from 17 percent in 1992.
China drives most of the region’s traffic. According to United Nations Conference on Trade and Development (UNCTAD), it’s now the world’s largest importer of dry bulk commodities such as coal and iron ore, mostly from Brazil and Australia, as well as of crude oil, from the Gulf states. China’s role as Africa’s biggest single trade partner is reflected in the dramatic rise in traffic along the Cape route, between Asia and South Africa.
“The Indian Ocean and China Seas are directly falling under the ‘China effect,’ ” says Cesar Ducruet, who researches global vessel movement at the French National Center for Scientific Research in Paris.
Demand from China as well as other Asian economies, he says, has made the Suez route between Europe and Asia the busiest in the world. The Suez route stretches across the Indian Ocean to the Suez Canal, passing through hubs in Singapore, Sri Lanka, Egypt, Italy, and Spain.
“On the Pacific side, America is a significant market, but just a single one. On the Suez route you get access to several markets at once—Europe, the Middle East, and Africa,” says Jean-Paul Rodrigue, a professor of transportation geography at Hofstra University in Hempstead, New York.
An Oversize World Fleet
Although the volume of international seaborne trade more than doubled between 1992 and 2012, from 4.2 billion tons to 9.2 billion tons, that’s only half the increase Tournadre observed in ship traffic—a discrepancy he finds surprising though not inexplicable.
For one thing, he says, a small part of the traffic increase may not be real. Ships have gotten much bigger over the past two decades, and so they’re more likely to be detected by satellite altimeters.
More important is an increase in the number of ships, which has led to a bloated global fleet. Following what UNCTAD calls the “largest shipbuilding cycle in history,” the carrying capacity of the world’s ships more than doubled between 1992 and 2012, from 695 million deadweight tons to 1.6 billion.
“It is now clear that many of the biggest shipowners invested too much in new ships,” says Ducruet, “thus leading to overcapacity, especially in times of falling demand.”
Because of that excess capacity, says Tournadre, individual ships are carrying less cargo than before and “slow steaming,” or cruising at slower speeds to cut fuel costs.
Finally, Tournadre says, though commercial cargo vessels make up the lion’s share of all ships, fishing boats, military vessels, and oil-rig supply ships also have contributed to the rise in traffic. “For example,” he says, “there is strong traffic growth off of Brazil, related to the development of offshore oil.”
Booming Emissions
Commercial vessels emit a variety of pollutants, and of them, perhaps the greatest source of concern is nitrogen dioxide—a compound that causes respiratory problems, soil and water acidification, and ozone formation. On satellite maps of nitrogen dioxide emissions, some of the main shipping lanes show up as clearly as they do on Tournadre’s maps.
“Since the early ’90s, NO₂ nitrogen dioxide pollution from ships as observed by satellite has increased significantly, in line with the reported increase in number of ships and volume of transported goods,” notes atmospheric scientist Andreas Richter of the Institute of Environmental Physics in Bremen, Germany.
Emissions from vessels headed to and from the Suez Canal are among the top sources of pollution in Egypt and Saudi Arabia, Richter says. Globally, shipping now accounts for 15 to 30 percent of nitrogen dioxide emissions.
Of course, ships also affect the ocean—through collisions with marine life, oil spills, the introduction of invasive species, waste discharges, and noise pollution, to name just a few of the impacts listed by the International Union for Conservation of Nature. The intensifying red lines on Tournadre’s maps document the global shipping boom, he says, but also “the increased human pressure on the open ocean.”
You can return to the main Market News page, or press the Back button on your browser.