
Canada's Environmental Indicators -- It's not getting better!
 Vancouver, Canada (GLOBE-Net) - Canada’s environment continues to face challenges with respect to air and water quality and greenhouse gas emissions according to the third annual Statistics Canada report on environmental sustainability indicators. The good news is that greenhouse gas emissions did not increase significantly between 2003 and 2005. The bad news is that we are 25% above our 1990 levels and 33% above our Kyoto targets. Statistics Canada also reports the indicator of exposure to ground-level ozone, a component of smog, has increased over this period and the water quality indicator shows guidelines for protecting aquatic life are not being met at many monitoring sites across the country.
The report - which will be released in its entirety in December – shows that Greenhouse gas emissions remained at nearly the same level in 2005 as in 2004, but are still significantly above 1990 levels and Canada’s target under the Kyoto Protocol. However, the report found that the intensity of greenhouse gas emissions — that is, the amount emitted for each unit of economic activity —continued to decline in 2005. Nevertheless, total emissions are rising due to increased economic activity.
As in last year’s report, the water quality indicator shows that guidelines for protecting aquatic life are not being met at least occasionally at many monitoring sites across the country. Phosphorous, a pollutant derived mainly from human activities, was a major concern for the quality of surface freshwater in Canada.
The indicator results are partly due to the growing Canadian population and economy. Between 1990 and 2005, Canada’s population increased by 17%, to 32.3 million. This increase, coupled with economic growth, led to greater resource use and waste production, increased greenhouse gas emissions and, in certain cases, more air and water pollution. Exposure to smog is increasing
The air quality indicators cited in the report track levels of Canadians’ exposure to ground-level ozone and fine particulate matter during the warm season (April 1 to September 30). These pollutants are key components of smog and can lead to adverse health effects even at low concentrations in the air. The report shows that the ozone exposure indicator increased by an average of 0.8% a year between 1990 and 2005. This is equivalent to an overall increase of about 12% between 1990 and 2005.
Regionally, the ozone exposure indicator increased in southern Ontario and in southern Quebec over the period. The indicator level was unchanged in other regions.
The exposure indicator for fine particulate matter did not show any significant increase or decrease between 2000 and 2005, the only period for which consistent data are available. Transportation, electricity generation, wood burning and the use of chemical products such as paint and solvents can increase levels of ozone and fine particulate matter in the air. Greenhouse gas emissions up sharply
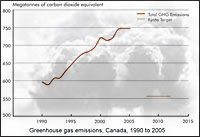
The consensus of the United Nations’ Intergovernmental Panel on Climate Change is that greenhouse gas emissions caused by human activity are having a discernible impact on the climate. In 2005, Canada’s greenhouse gas emissions were estimated at 747 million tonnes of carbon dioxide equivalent, up 25% from 1990. These emissions were 33% above the target set by the Kyoto Protocol.
Greenhouse gas emissions increased significantly between 1990 and 2005, despite the fact that 17.8% less greenhouse gas was emitted per unit of economic activity in 2005 compared with 1990. Increases in overall economic activity resulted in increases in both energy use and greenhouse gas emissions. Contrary to the general trend since 1990, greenhouse gas emissions were nearly stable between 2003 and 2005. This change was due primarily to a reduction in emissions from electricity production (reduced coal-fired generation and increased hydro and nuclear generation), reduced demand for home heating fuels due to warm winters and a reduced rate of increase in fossil fuel production.
Greenhouse gas emissions from the oil, gas and coal sectors increased by 48% from 1990 to 2005, reflecting sustained growth in the production and export of fossil fuels. Emissions from road transportation rose 33% over the same period, mainly due to a shift in consumer preference from automobiles to less fuel-efficient minivans, sport utility vehicles and small pickup trucks, as well as an increase in heavy truck transport. Emissions from thermal-electric power and heat generation grew by almost 37% from 1990 to 2005, driven primarily by a rising demand for electricity and an increase in the use of fossil fuels to generate electricity.
Freshwater quality - a concern for aquatic life This indicator assesses surface freshwater quality with respect to the protection of fish, aquatic invertebrates and plants. It does not assess the quality of water for human consumption and use. The indicator is based on information gathered from 2003 to 2005.
Water monitoring results throughout southern Canada show that guidelines for protecting aquatic life were not being met at many sites. Tests at 359 river and lake monitoring sites in southern Canada found that freshwater quality was rated as “good” or “excellent” at 44% of the sites, “fair” at 33%, and “marginal” or “poor” at 23%.
The report found that phosphorus was a major concern for surface freshwater quality in Canada. Phosphorus levels in southern Canada did not meet the water quality guidelines for aquatic life over half the time at 127 of 344 monitoring sites. Most phosphorus in water comes from sewage, agricultural runoff and industrial wastewater.
An oversupply of phosphorous in water can result in excessive growth of aquatic plants such as algae and reduce the amount of dissolved oxygen available for fish and other aquatic animals. Some algal blooms can be toxic, threatening livestock and human health.
Manufacturing and service industries, institutions and households discharge hundreds of different substances, directly or indirectly, into rivers and lakes. At least 115 000 tonnes of pollutants were directly discharged to Canada’s surface waters (both freshwater and coastal) in 2005. Many pollutants also make their way into water bodies indirectly after being released into the air or onto the land.
Runoff from agricultural lands and urban areas with high concentrations of nitrogen and phosphorus can also degrade water quality, as can changes to water flows. Natural phenomena such as seasonal snow melt and heavy rainfall can also be responsible for water quality measurements not meeting guidelines; for example, they can increase levels of suspended sediments that are often high in nutrients and metals.
The report, Canadian Environmental Sustainability Indicators: Highlights, 2007 (16-252-XWE, free), is now available online at www.environmentandresources.ca/indicators.
For More Information: Statistics Canada
You can return to the main Market News page, or press the Back button on your browser.